Analytical Accuracy (Bias)
The accuracy of analysis should be an expression of the degree to which a measurement of concentration reflects the true value. Since it is seldom possible to determine the true value of an analyte, accuracy of analysis is expressed in terms of a measurement of a relative deviation away from an expected (or accepted) value.
Calculating Analytical Accuracy
The calculation of analytical accuracy is relatively simple providing the measurement of accuracy is clearly defined.
Accuracy is a measure of Lack of Bias, expressed as a percentage of the expected (or true) value at better than a 95% confidence level.
Note: A common problem when quoting accuracy figures is that there are many different ways in which accuracy has been defined and calculated. In particular many people use an absolute accuracy rather than a relative accuracy.
Accuracy can only be determined by repeating a known sample, preferably a primary standard with an agreed true value, several times.
Firstly determine the mean and standard deviation of the samples tested:

where:
-
 is the mean,
 -
 is an individual result, and
 -
 is the number of results.
Accuracy is then determined as the level of bias between the measured value and expected value  :
:

Finally, check that this is significant at the 95% confidence interval. The calculated accuracy must be less than or equal to the accuracy calculated by the following formula:

Note: This is approximately equal to twice the relative standard deviation.
If the computed accuracy is not below the 95% confidence interval then you must assume that despite being able to gain reproducible results your method is BIASED, compared with other methods. Quoting an accuracy figure under these circumstances is not valid.
Calculating Control Limits On Analytical Accuracy
For example, the control limits on a standard sample can be defined as:
Upper Action Limit = EV + 3.09 x SD
Upper Warning Limit = EV + 1.96 x SD
Lower Warning Limit = EV - 1.96 x SD
Lower Action Limit = EV - 3.09 x SD
where:
- EV is the Expected Value, and
- SD is the Standard Deviation (of the distribution about the Expected Value).
Note: Note that the control limits are expressed in absolute terms (rather than as a percentage difference from the expected values.)
Defining Control Limits On Analytical Accuracy
Two types of tests for accuracy are carried out within CCLAS. Firstly, checks on the accuracy of routine readings of standard samples and secondly checks on the readings of blank samples ensuring that they are lower than a stated limit (the Statistical Detection limit).
The acceptable accuracy of standard sample determinations vary with sample type and method of analysis (scheme) and individual control limits must be stored in the Standards Database as a tolerance in percent above and below the expected value.
The Tolerance % on Standard Samples is converted into the absolute warning and action limits each time it is used by the CCLAS software in quality control tests.
The acceptable accuracy on blank sample determinations is dependant on the Detection Limit for the scheme. The CCLAS system uses the Statistical Detection Limit, stored in the Schemes database as the upper action limit and calculates the other control limits centred around zero.
The accuracy on blanks is tested for both positive and negative bias compared with zero. A significant negative bias can be due to poor calibration, rather than just poor repeatability at low concentrations.
Note: The accuracy on blank samples is tested in absolute terms about the zero concentration and should be lower than the Statistical Detection Limit. The Statistical Detection Limit is also used to specify analytical precision at low concentrations and should be comparable to the stated Detection Limit for the Scheme. This stated Detection Limit is only used in the reporting and rounding of results and is not used during quality control checks.
Control Charts For Analytical Accuracy
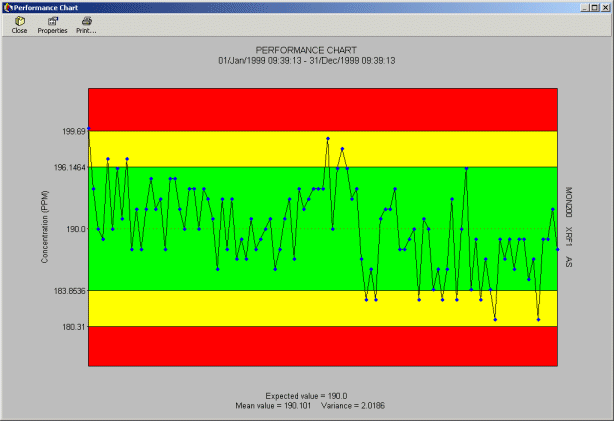
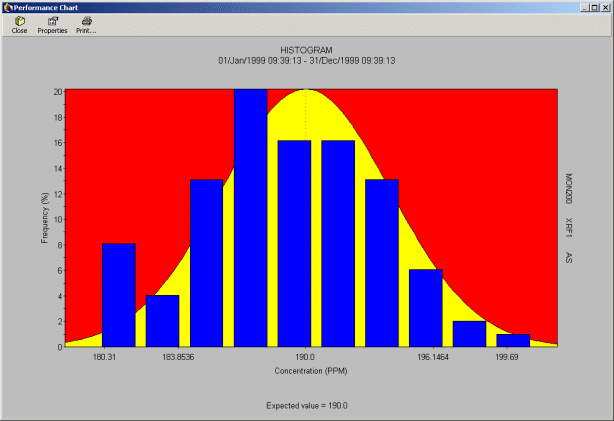
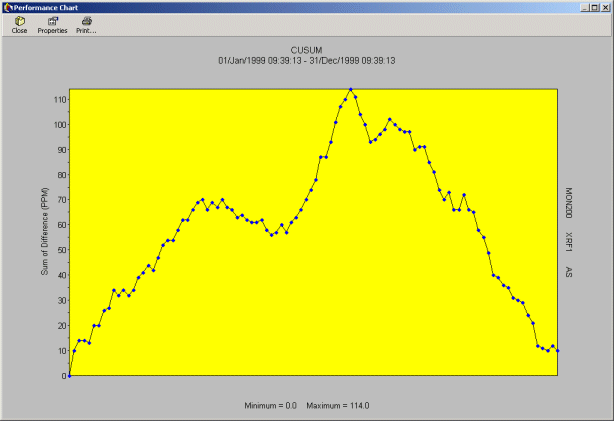
The Standard analysis option within the QC module can produce three types of control charts for analytical accuracy on standards.
X-Chart - Standards
This performance chart is a graph of the value of a standard sample within the given control limits, plotted against the number of observations. This is very useful in assessing the variation of analyses with time. Variation between batches, instruments and operators are often most clearly shown on this chart. Both bias and precision can be observed from this chart.

Histogram Chart - Standards
This is a relative frequency histogram. Each vertical bar represents the relative frequency of a sub-interval (referred to as classes in statistics) of concentration range. Relative frequency is the number of samples falling within a particular sub-interval, expressed as a percent. Bias, precision and any skew can be observed from this chart.
The user of this chart can highlight whether this population is normally distributed.

Cusum Chart - Standards
The chart quickly identifies any consistent bias between expected and actual results. The error between the expected and the actual result are accumulated and displayed as an ongoing chart. Any consistent biases are reflected in an upward or downward movement in the chart.

The same charts are available for analysis of blank samples and will display similar information with regard to contamination.

