Analytical Repeatability (Precision)
The precision of analysis should be an expression of the degree to which an analytical result can be reproduced. It is important to note that the relative repeatability will vary with concentration and there is a linear correlation between the spread of a distribution (measured as a standard deviation) and concentration.
Calculating Analytical Precision
The methods used to calculate and define analytical precision are based on the concept of Duplicate Analysis - a set of techniques developed by M. Thompson and R. Howarth of the Imperial College, London.

where:
-
 is the standard deviation at zero concentration,
 -
 is the limiting repeatability, and
 -
 is the concentration at which the precision is to be calculated.
Note: As a rough guide, analytical precision at a certain concentration can be approximated to twice the Relative Standard Deviation (RSD) at that concentration. This corresponds to the 95% confidence interval on precision.
Calculating Control Limits On Analytical Precision
The control limits derived for testing acceptable analytical precision are similar to those used to test accuracy (i.e. they are based on an action limit of only 1 in 1000 samples being correct and yet falling outside the limits and only 1 in 40 samples being expected outside the warning limits). However, this time it is tested against the Half-Normal distribution, since the percentage difference between duplicates is expressed in absolute terms. The control limits on precision can then be expressed as:


The statistical detection limits ( and
and  ) are defined as the points at which precision is 100 %.
The  corresponds to the 95% confidence equivalent of
  .
.


The  is the 95% confidence limit on repeatability at high concentrations.
  corresponds to the 99.8% confidence equivalent of
  at high concentrations.


where:
-
 is the statistical action detection limit,
 -
 is the statistical warning detection limit,
 -
 is the standard deviation at zero concentration,
 -
 is the limiting repeatability,
 -
 is the action limit on repeatability, at high concentrations,
 -
 is the warning limit on repeatability, at high concentrations, and
 -
 is the concentration at which the precision limit is calculated (usually the mean value of the two duplicates).
The calculations begin with a test for bias, since a consistent bias between duplicate pairs will invalidate the precision estimate which is meant to detect variation due to random errors only.
The first bias test finds the number of positive differences (i.e. original sample was higher than the repeat sample) and this should be approximately 50% of the total number of samples, otherwise bias should be suspected. The number of positive differences is also converted to a normalised value and the probability of obtaining that number of differences or greater can be checked on a table of the area in the tail of a normal distribution.
To give a qualitative assessment of the relative importance of this bias both the mean percentage difference (MPD) and absolute mean percent difference (AMPD) are used and are defined by the following (relative to each pair of observations):


The  gives an approximation of the magnitude and sign of the bias and therefore should be close to zero. The
  gives an approximation of the magnitude of the relative repeatability, for unbiased schemes it should be close to the expected precision at high concentrations.
Note: Mean Percent Difference (MPD) and Absolute Mean Percent Difference (AMPD) are not true measures of accuracy or precision and are subject to many errors in calculations. They are included here as a guide to the assessment of the possible source of bias.
Next, the pairs of samples are assembled in small groups according to concentration ranges. After calculating the mean of each range and standard deviation of differences within each range, a regression of this standard deviation against concentration is carried out.
The intercept of the regression line at zero concentration is an estimate of Standard Deviation (SDo) and the gradient is equivalent to limiting repeatability divided by 200.
The Estimated Statistical Detection Limit and Limiting Repeatability are then calculated and a simple tabulation produced showing the expected precision at various concentration levels.
Defining Control Limits On Analytical Precision
The acceptable precision on analysis varies with the analytical scheme and analyte being determined. A separate statistical detection limit and limiting repeatability must be entered for each scheme and analyte in the Schemes tables.
When setting up a new scheme it is wise to set the statistical detection limit to be the same as the stated detection limit. Then adjust it as sufficient duplicate determinations become available to carry out meaningful calculations.
Control Charts For Analytical Precision
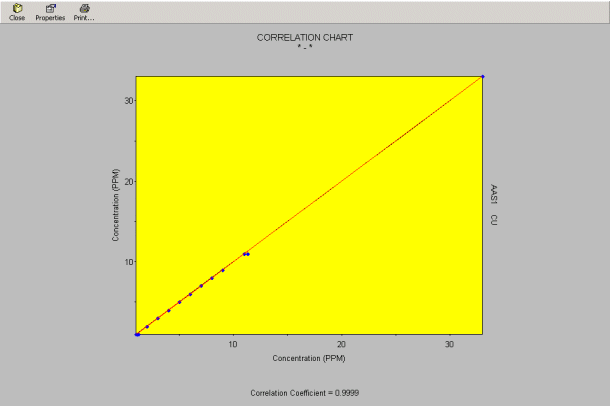
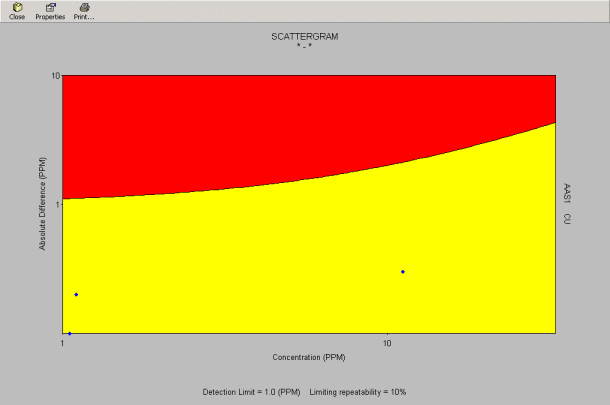
The Replicate, Duplicate and Replicate/Duplicate analysis options within the QC module can be used to generate several control charts for analytical precision, including the Scatter Plot, Correlation Chart and PCurve (Precision Curve).


The Scatter Plot provides a convenient control chart on analytical precision. Any points falling above the ACTION line are out of control, and the scatter of points should be sub-parallel to and below the ACTION line. Unusual clusters of points or several outliers at a particular concentration range will be diagnostic of poor areas of analytical reproducibility, the most common problem being that of inappropriate instrument calibration. If the scatter plot shows a distinct step in the clusters that match the concentration at which the instrument is recalibrated, then it will be wise to introduce smaller calibration steps.
Relating Accuracy And Precision
There is always an inter-relationship between analytical accuracy and the precision within which it can be expected. In general the accuracy at any concentration should match or be lower than the expected precision at the same concentration for each method. There are, however, three common exceptions to this general case which require monitoring:
- An analytical method may produce very reproducible results (particularly at higher concentrations) but be significantly biased compared with similar methods in other laboratories. This is undesirable and should be investigated by an inter-laboratory test and a thorough investigation of accuracy.
- The Statistical Detection Limit can sometimes be much larger than the nominated Detection Limit for the scheme. This may mean that the nominated detection limit is artificially low and should be increased to a more realistic level. Alternatively it may indicate a sampling or preparation problem. (e.g. when analysing for trace levels it is important to ensure that a large enough sample is taken and that it is finely prepared otherwise there is a problem of having only one particle of the analyte or no particles. This introduces an artificial threshold which will effect the calculation of statistical detection limit).
- A small analytical bias that is lower than the anticipated analytical repeatability will go undetected. If analytical accuracy is vital a qualitative evaluation of the level of bias can be made using the CUSUM control charts, however, little can be achieved without improving the reproducibility of results. This situation can commonly be seen as an inter-batch variation on standard and blank samples.

