View Blast Relief Rates
For context, see Initiation Analysis.
Activity Steps
- Select the Initiation module.
- Right-click the initiation pattern in the DataBlast Items Tree, and select View Relief from the menu.
Alternatively, if you already have the initiation pattern displayed in the Viewport, on the Analysis Ribbon Menu, click View Relief.
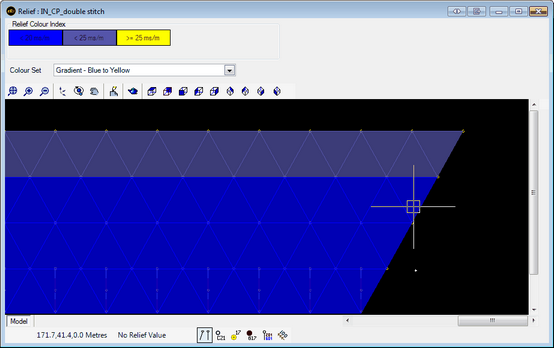
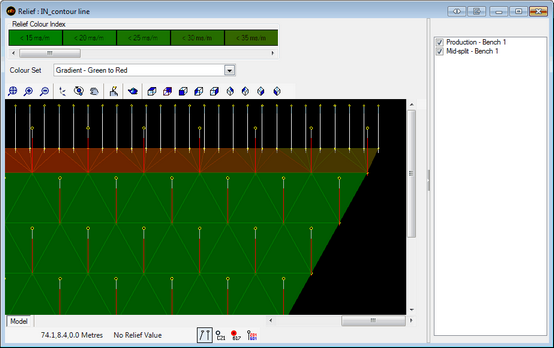
The Relief screen displays the calculated relief triangulated between the holes.
If you hover your mouse pointer over the diagram, the toolbar displays the coordinates and calculated relief value at that location.

- If the initiation pattern is electronic, select the timing objects to display.

- Select the Colour Set from:
- Gradient - Blue to Yellow (default)
- Gradient - Green to Red
- Fixed - Rainbow
- Fixed - Blue, Green, Orange, Red, White
- User Defined - Gradient—Select a Start Colour and End Colour.
- User Defined - Fixed—Click a colour in the Relief Colour Index to display a colour picker.

