View Decks per Delay
For context, see Initiation Analysis.
Activity Steps
- Select the Initiation module.
- Right-click the initiation pattern in the DataBlast Items Tree, and select View Decks Per Delay from the menu.
Alternatively, if you already have the initiation pattern displayed in the Viewport, on the Analysis Ribbon Menu, click View Decks Per Delay.
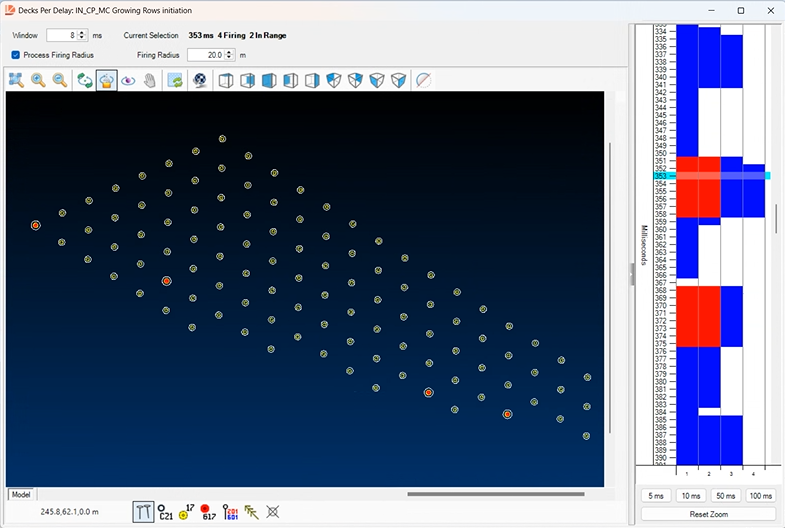
The Decks Per Delay screen displays.
- Update the Window if required. Default: 8 ms.
- Select whether to Process Firing Radius.
- Update the Firing Radius if required. Default: 10 m or 30 ft.
- Select a zoom level from 5 ms, 10 ms, 50 ms or 100 ms, or click Reset Zoom.
- Select a horizontal bar in the time window to see which holes are firing within the Window number of milliseconds of the selected delay time.
If Process Firing Radius is checked, red bars indicate holes that are within the Firing Radius of each other. Blue bars indicate holes that are firing together but are further apart.
The summary displays above the Viewport, and the icons of applicable holes change in the Viewport.
In the following example, four holes are firing within the same window of time. The two highlighted holes in the bottom-right are within 20 m of each other.