
View blast timing contours
For context and examples, see Initiation analysis.
Activity steps:
- Select the Initiation module.
- Right-click the initiation pattern in the DataBlast Items Tree, and select View Timing Contours from the menu.
Alternatively, if you already have the initiation pattern displayed in the Viewport, on the Analysis ribbon menu, click View Timing Contours.
The Timing Contours screen displays.
- Update the Contour Interval if required. The smaller the interval, the more contour lines display. Default: The Initiation Contour Interval specified in Local settings.
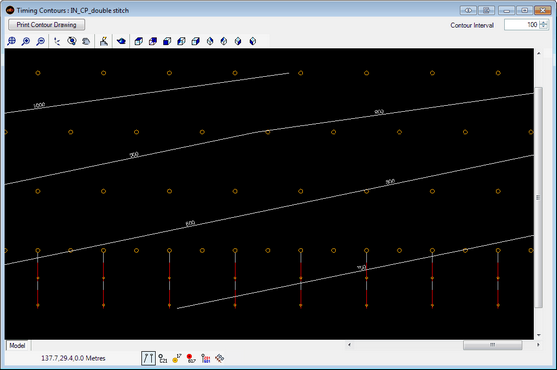
- On the Layers toolbar (Initiation module), click Show/Hide Contour Arrows to show or hide arrows on the contour lines.
Contour arrows show the blast direction from the highest timing to the lowest timing. The arrows point towards the lower timing zone.
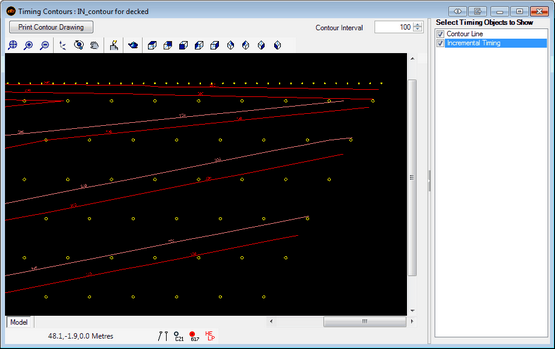
- If the initiation pattern is electronic, select the timing objects to display.
- To print the contours:
- Click Print Contour Drawing.
- Adjust the print area and select printing options as required. See Print viewport objects.
Note: Printed electronic timing contours use the white background colour from the applicable Z timing zone. Printed non-electric timing contours use black contour lines.
