Vibration Modelling
DataBlast Pro uses a modified scale distance relationship to model ground vibration.
Where:
- V—The seismic velocity of the ground between the blast and the monitor point. This is used to calculate the arrival time of the blast waves at the monitor point in order to determine reinforcement.
- k—Ground transmission constant, chosen from regression analysis.
- D—Distance from the monitor.
- Q—Maximum instantaneous charge.
- a—Geological constant, usually around -1.3, chosen from regression analysis.
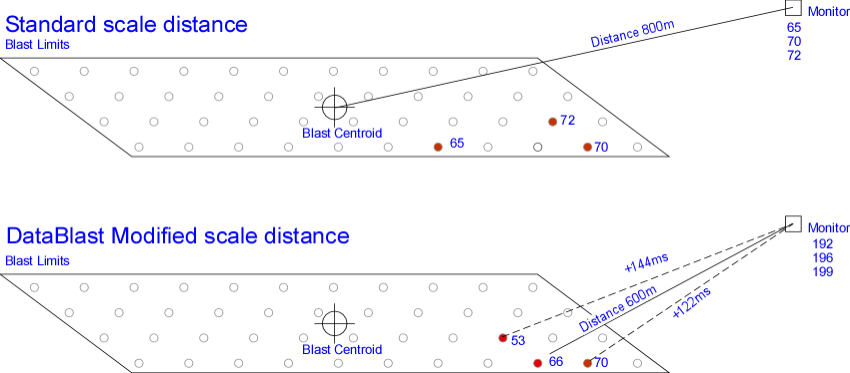
Many standard analyses assign Q using an 8 millisecond window based on the nominal firing time of the individual holes and a distance averaged to the centroid of the blast. This is not what a monitor 'sees'. The distance is to the actual holes firing and the firing time is modified by the distance to the monitor and the ground velocity.
These modifications are applied in the DataBlast Pro vibration model. At each monitor point, the firing time is the nominal time plus the travel time. The distance is the average to the holes contributing within the specific window.
The following diagrams illustrate the difference between the two models.

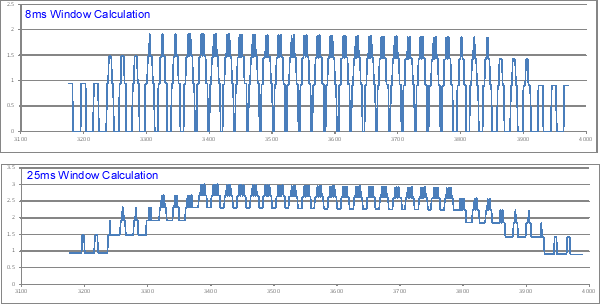
A further enhancement is the calculation of vibration throughout the blast duration in one millisecond increments rather than using the maximum instantaneous charge and the average distance. This functionality enables examination of the characteristic waveform traces using different time windows and comparison to the recorded trace. The following diagrams illustrate the difference between vibrations from the same design being calculated for both 8 and 25 millisecond windows.

Monitor point locations may be fixed or mobile. See Maintain Fixed Vibration Monitor Points. Mobile monitor points are added during vibration analysis. See View Vibration Analysis.
The vibration analysis can be exported as a CSV file. See File Formats. The CSV file includes three sets of data per monitor point for which data is displayed in the analysis:
- The location and settings of the monitor point.
- For each hole in the initiation pattern: the deck index, distance to the monitor point, deck charge mass, deck firing time and wave packet arrival time.
- For each millisecond after initiation: the number of decks firing and calculated values for instantaneous charge, average distance, scale distance, seismic velocity K50 (the most likely result) and seismic velocity K95 (the 95th percentile result).

