
Define Dashboard Item Details
Dashboard items are configured using the Dashboard Report screen, comprising Details, Datasource and Filters panels.
The Details screen is used to define the general properties of the dashboard item, including the dashboard item chart type, the main title and position. You can also set the frequency of data items here (say, every schedule period, every other period or even lower frequencies, and you can constrain the date range for the chart.
Tip: Use the middle mouse wheel to zoom in or out of dashboard item data.
Tip: Disable Design Mode and left-click-drag to rotate the view of 3D dashboard items. See Dashboard 3D Item Key Shortcuts.
To toggle Dashboard Design Mode on or off:
-
Right-click an empty part of any dashboard.
-
Select Design Mode to toggle this state on or off. If on, a tick appears next to the menu entry.
To configure the general properties for a dashboard chart item:
-
Display a dashboard view with at least one dashboard item.
-
Ensure Design Mode is active:
-
Right-click an empty part of the dashboard.
-
If Design Mode is inactive (no tick appears), select it.
-
-
Right-click the dashboard item to configure and selected Edit Item.
The Dashboard Report screen displays, displaying the Details tab.
-
Configure the dashboard item details:
-
Title – The primary chart title that appears above the chart.
-
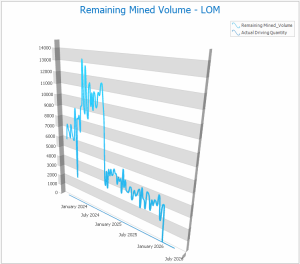
Chart Type – Choose the chart type from the wide variety provided. For example, here's a 3D spline chart (a line chart connecting data points with bezier curves):
-
Position – Set the position of the edges of the chart item from the edges of the viewing area (Top, Left) and the size of the item (Width, Height) in pixels.
-
Start Date, End Date – Choose the initial and final dates between which to display data.
-
Period – Define the data interval for chart values. For example, to display data for every 5th day, set Period to 5 and Period unit to Days.
-
-
Click OK to update the chart item.

Note: Additional annotations, including legends, subtitle and visual formatting options can be set using the Chart Designer.
Related topics and activities