
Crosstab and Histograms
The resource usage for a schedule can be displayed on the Crosstab as either a Crosstab per resource or histogram per resource.
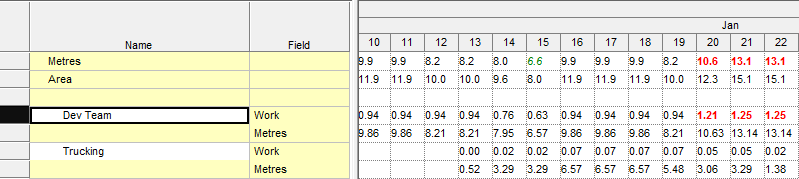
Multiple fields can be displayed for each resource:
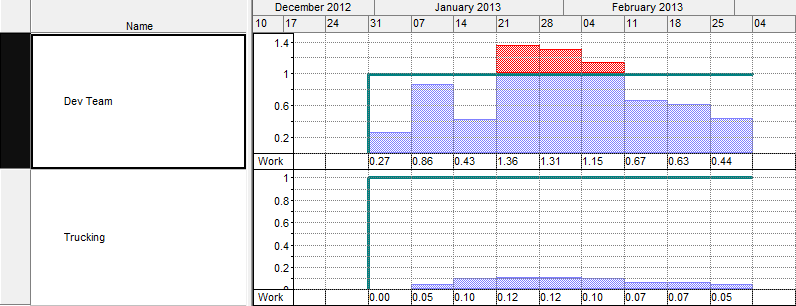
A histogram of fields can be displayed for each resource:
Some fields are specific to resources:
- Work - the total work scheduled for the resource. Use Period Total format to display in hours, or Number Of to display the number of resources required.
- Work Available - the total work capacity of the resource based on the availability
- Over-Allocation - the work scheduled above the available resource capacity. If this field is used on a histogram along with Work, it will automatically be drawn between the availability and the total work.
- Total Cost - the total cost of using the resource based on its Unit Cost field.
Additionally any production fields can be displayed for each resource. If the multiple driving resources are assigned to a task as Combined rate of resources the portion of the property scheduled for each resource is displayed, e.g. if a task has 150 000 tons and both Shovel A ( rate of 1000 t/d) and Shovel B (rate of 500 t/d), the Crosstab will report 1000 tons for Shovel A and 500 tons for Shovel B per day respectively. Otherwise the production of the tasks assigned to the resource is reflected on the view.