The Timeline
The Timeline area is intended to give an overview of the entire project length, and specifically highlight the portion that is currently visible in the bar chart view (or Crosstab view).
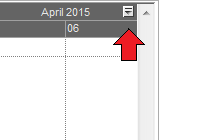
The timeline view can be enabled (toggled on or off) by clicking the button in the top-right corner of the date scale, as highlighted in the image below.
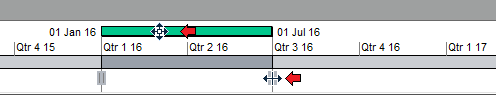
This will show the timeline view below the ribbon bar. The project start and end dates are shown. The blue bar indicates the current view, i.e. the region that is visible on the charts.

You can interact with the timeline by dragging the bar left or right. This will change the date of the left-hand edge of the charts. Alternatively you can drag the grippers left or right to change the scaling.