
Local Grid Tool
Discover for ArcGIS Pro provides an array of comprehensive tools for data import. Frequently, the data is sourced from a local or mine grid that lacks reference to its position within a real-world coordinate system.
Given that ArcGIS Pro functions as a GIS system, it requires knowledge of the coordinate projection system to visualise data accurately. To display data in a GIS, you need an XY and Z coordinate and a projection system. Discover for ArcGIS Pro's Local Grid Tool helps to determine an ArcGIS Pro local grid using the data you have available.
ArcGIS Pro Local Grid
For information on the local grid, see https://pro.arcgis.com/en/pro-app/latest/help/mapping/properties/local.htm.
Example
The Discover for ArcGIS Pro determines the above parameters by using a control point table, where the corresponding local grid coordinates, real-world coordinates, and projection system are known.
| Local_X | Local_Y | Real_World_Easting | Real_World_Northing |
|---|---|---|---|
| 25 | 50 | 530737.745 | 6002749.407 |
As a user you could calculate a local grid in ArcGIS Pro manually, using two points which have the same local grid northing for convenience, we can determine the above parameters as follows:

To create a local grid, the following parameters are required:
- Azimuth—The two points in the local grid share the same Easting along the line drawn between them. The red line should represent the North-South Line of the local grid. By comparing the angle between this line and the real-world grid's North-South Line (shown in blue), we can determine the azimuth.
- False Easting—The local grid easting at a known real-world point.
- False Northing—The local grid northing at a known real-world point.
- Longitude Of Center—The corresponding longitude of the known False Easting point.
- Latitude Of Center—The corresponding latitude of the known False Northing point.
- Scale Factor—In the above image, we know that the Northings are 100 units apart in the local grid, with point 1 having a Northing of 100 and point 2 having 200. If we measure the distance between these points in the real world and find it to be 99 units, we can calculate the scale factor by dividing the real-world measurement by the local grid measurement. The resulting value is a scale factor of 0.99.
Using these parameters we could create a local grid manually in ArcGIS pro using the New Projected Coordinate system tool.
The Discover Local Grid Tool
The Discover Local Grid Tool has the advantage over the manual method as it can calculate the average of a large group of points. It accomplishes this by using the root mean square (RMS) method to acquire a line of best fit for both azimuth and scaling.
The tool cleans up data by removing any outlier points that are more than 1.5 times the RMS value, subsequently recomputing the transformation.
The false Northing and Easting position are calculated from the mean of the local Northings and Eastings in the datasets. This approximates a midpoint of the data around which the data is rotated, acting as the azimuth pivot.
The azimuth and scale factor are initially calculated using computed conformal parameters. The azimuth holds the most significant impact on grid accuracy, as it's a rotation that is iteratively refined to achieve the best RMS fit for the data. It begins by calculating the RMS value of the initial azimuth, then obtaining the RMS value of the azimuth two degrees on either side. The more accurate side is determined through this comparison. The calculation is repeated using one degree, determining which value between the initial two-degree and one-degree results in greater accuracy. This process is repeated twenty times until the most accurate azimuth with the lowest RMS is determined.
Upon completion, the tool provides the local grid and RMS error, approximating the accuracy error within the local grid's unit. The resultant Local Grid is then saved among your preferred coordinate system settings.
Things to Avoid
Note: The Local Grid Tool provides an approximation of a local grid; it is not a tool of high accuracy. Given its reliance on rotation, the accuracy of the data diminishes as you move further from the longitude and latitude of the central point. As a result, it is suitable for historical exploration data but unsuitable if you intend to develop a portal for a decline.
Because the local grid depends on rotation, it is important to ensure that the data used for its calculation conforms to the specific area where it is be applied. Avoid calculating a local grid from data in one location and subsequently using it to position data that is outside the same area.
For example, if you calculate a local grid from points in the red square as shown in the image below, the latitude and longitude of the center are designated at the blue dot. This causes all data to revolve around this point based on the azimuth's magnitude.

If we then introduce the remaining points as shown in the image below, all of this data pivots around the blue dot, irrespective of its position within the scene. Thus, the rate of inaccuracy intensifies as data moves farther from the blue dot, given that it is subject to rotation at that specific point.

The local grid should have been calculated using all the data available for greater accuracy. The scenario described above leads to unacceptable levels of error in your data.
Activity Steps
- Navigate to the Map that contains the control point data.
- In the Contents Panel, right-click the control point layer and select Attribute Data from the drop-down menu.
Note: Local Grids can be produced from table data or feature classes attribute data. The data do not need to be mapped as spatial objects.
- On the Discover ribbon tab, in the Tools group, select Local Grid Tool.
The Local Grid Tool panel displays.
- To Create from control points, complete the following parameters:
- To select a Coordinate Reference System (CRS), click the globe icon and select a CRS.
- Select the control points file in the Control Point Table.
- Select the column that has the Local Easting.
- Expand and select the column that has the Local Northing.
- Select the column that has the Real Word Easting.
- Select the column that has the Real World Northing.
- Select the Local Map Projection Units from:
- Meters
- Kilometers
- Centimeters
- Millimeters
- Inches
- Feet
- US Survey Feet
- Yards
- Miles
- Nautical Miles
- Enter the Local Grid Name.
- Click Apply.
A notification similar to the one in the image below displays:
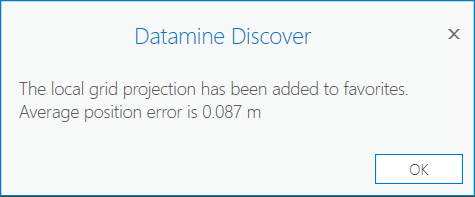
Note: This shows the average accuracy of the points is 0.087 m, which is acceptable. This figure varies depending on your data. If the data error is over 2 m, you may have an issue with your control point table, which you need to fix.
- Open a New Map.
- Select the Insert tab.
- In the Project group, expand New Map and select New Map.
- In the Catalog pane, right-click Maps.
In the drop-down menu, select New Map.
- Right-click the Map and select Rename from the drop-down menu.
- Rename the Map.
- In the Contents pane, right-click the layer that contains the control points and select Properties.
The Map Properties window displays.
- Click Coordinate System.
- Select the CRS for the local grid you created.
- In the Catalog pane, select the Local_Grid_Tool.gdb and drag the grid's point feature class into the Map window. The data is projected into the local grid.
Note: Any data associated with this project in this local/mine grid is associated with this CRS when it is imported.