
View a Dashboard
The Dashboards allow users to access global dashboards or to build their own personal dashboards of interest.
The content from the dashboards is based on an existing configuration being saved in one of the analysis screens.
To access the Global dashboards, select Global and choose from the available configurations (dashboards) or start to type the name in the search box. To load, click on the dashboard name.
Note: Only users that create or have the appropriate permissions are able to delete global dashboards.
Up to 4 existing configurations can be added to a dashboard. Placement and sizing of the 4 configurations within the dashboard is at the users discretion.
To focus on some of the features available within the dashboards screen, a zoomed in image of the first configuration (the first square above) has been done.
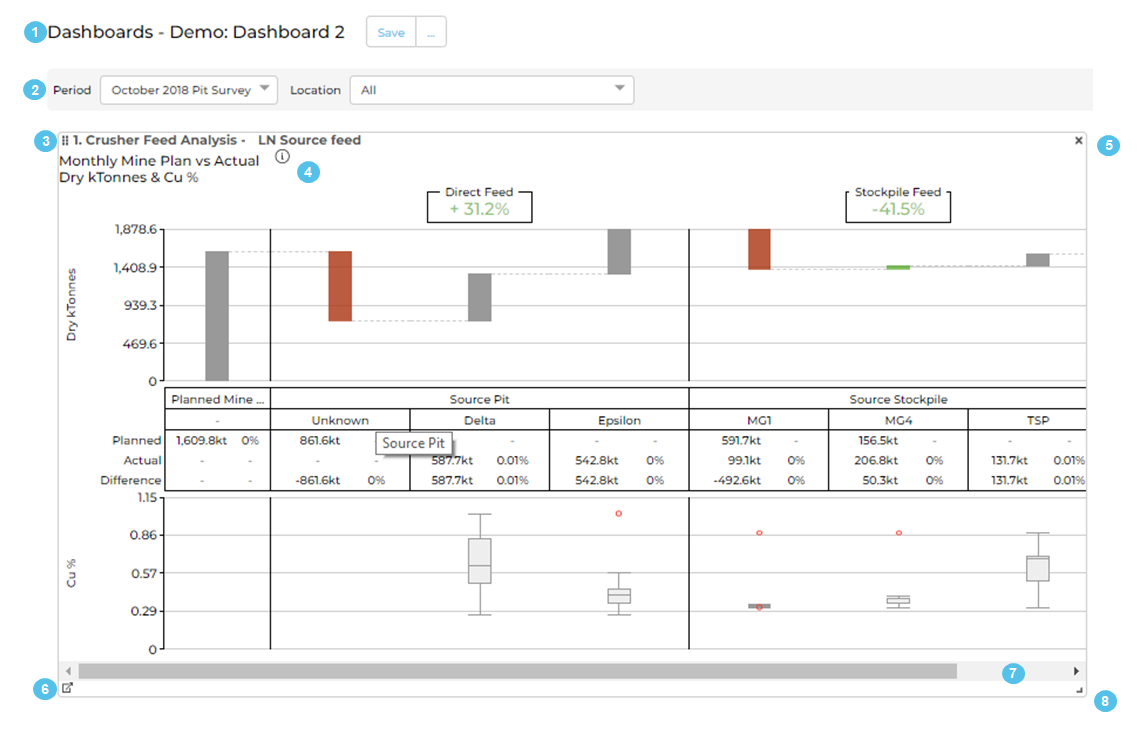
- The title of the Dashboard that has been loaded. Options to Save as, start a new dashboard, edit your own dashboard are located at the end of the dashboard name.
- The global period and location filter will be applied to all configurations shown in the loaded dashboard. This filter will also load into the original configuration when Item 6 is selected.
- Pressing the 6 dots before the name of the configuration will turn the cursor into a crossbar where the position of the configuration can be moved within the screen.
- The name of the original configuration that has been allocated to configuration #1 of the dashboard.
- Quickly delete a configuration from the dashboard.
- Open the configuration in the original analysis window, loaded with the period and location filter from the dashboard. This allows users to proceed with further investigation. This will not affect the dashboard configuration and is available to any user that has access to analysis screens.
- Scroll the configuration if it doesn’t fit cleanly on the reserved space.
- Resize the reserved space for the configuration (minimise and maximise).