Crusher Feed Results
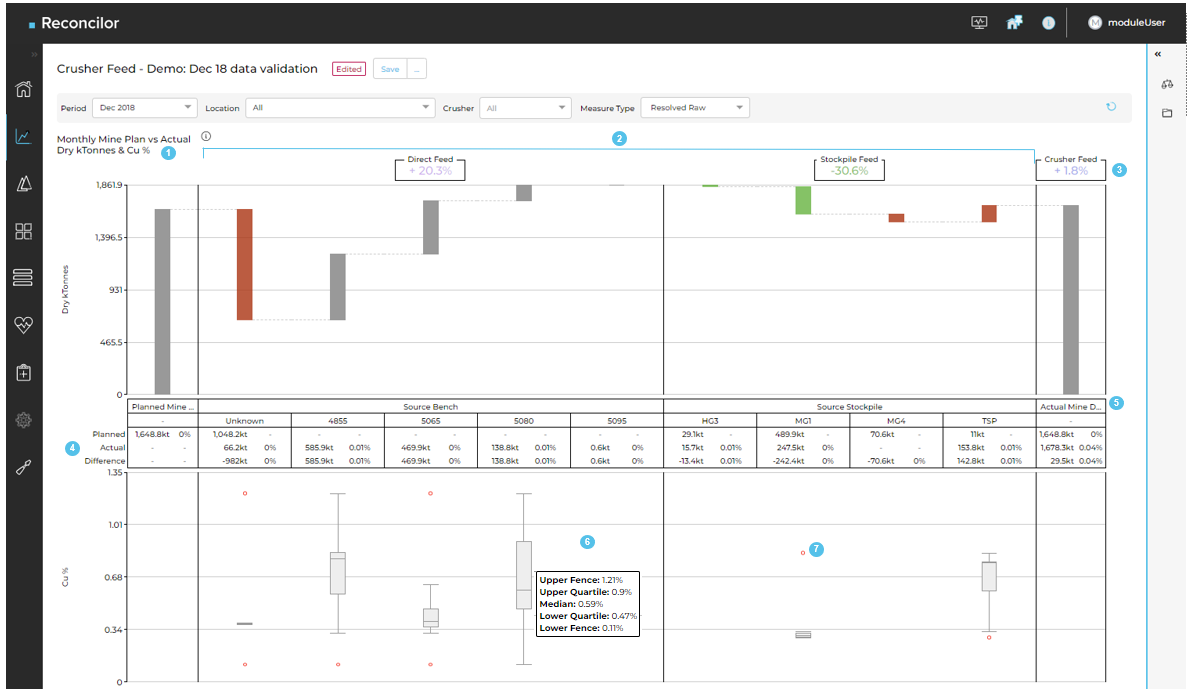
The following screenshot is an example of the crusher feed results. Numbered annotations in the image correspond to the explanations below.

- Chart information – Plan type, tonnes and grade. Click the information icon to display the associated mine plan name and details.
- Direct Feed and Stockpile Feed – Metrics are grouped according to the grouping options selected in the Configure panel. The percentage value associated with each metric relates to the planned / actual tonnes variance for that particular metric.
- Crusher Feed – Total of Direct Feed and Stockpile Feed production. The variance is the total planned / total actual production.
- Planned Mine Delivered (to the Crusher/s) – Dependent on the Mine Plan selected in the Configure panel and displayed in the chart title (see 1). The table provides the detail of tonnes and grade for each component of the metric defined by the grouping selected in the Configure panel.
- Actual Crusher Feed – Mine Production where the destination is a crusher.
- Box and Whisker Plot – Grade distribution for the material that is in each grouping. The detail in the pop up box provides the median grade (straight line), followed by the upper and lower quartile (the boxed area) with the upper and lower fencing (the ends of the whisker).
- Outliers – Shown as a red circle. Displays if Show Outliers is checked in the Configure panel. Hover on the outlier to see the grade associated.

