
CSMODEL Process
To access this process:
- Estimate ribbon >> Conditional Simulation >> Create.
- View the Find Command screen, select CSMODEL and click Run.
- Enter "CSMODEL" into the Command Line and press <ENTER>.
See this process in the Command Table
Process Overview
Note: This is a superprocess and running it may have an effect on other Datamine files in the project.
Create an output model, reserve or plot file based on percentile values, simulated points and cutoff grades.
The CSMODEL process does the following:
- inputs a regular grid of simulated points (POINTS) as created by SGSIM for multiple realizations.
- inputs a file (QUANTILE) specifying a set of percentile values.
- inputs a file (CUTOFF) specifying a set of cutoff grades.
- creates an output model file (SIMMOD) by averaging the simulated points lying within each parent cell giving an average simulated grade for each realization
- creates an output model file (STATMOD) giving statistics, quantiles and proportion and grade above cutoff for each parent cell.
- creates an output reserves file (RESERVES) giving the tonnes, grade and metal above cutoff for the total model.
- creates output plot files (PLOT) displaying the tonnes, grade and metal above cutoff against cutoff for the total model.
Averaging Simulated Points
The parameters describing the regular grid of simulated points are read from the default values of the implicit (non stored) fields in the input POINTS file, as created by the SGSIM process. These values are stored in terms of the equivalent block model.
| Field |
Stored |
Description |
|
XPT |
Yes |
X coordinate of simulated point |
|
YPT |
Yes |
Y coordinate of simulated point |
|
ZPT |
Yes |
Z coordinate of simulated point |
|
SIMNUM |
Yes |
The default value of SIMNUM must be set to the number of realizations in the input POINTS file. This is done automatically by SGSIM. |
|
{grade} |
Yes |
Simulated value |
|
XPPPC |
No |
Number of points per parent cell in the X direction |
|
YPPPC |
No |
Number of points per parent cell in the Y direction |
|
ZPPPC |
No |
Number of points per parent cell in the Z direction |
|
XMORIG1 |
No |
X origin of model |
|
YMORIG1 |
No |
Y origin of model |
|
ZMORIG1 |
No |
Z origin of model |
|
XINC1 |
No |
Parent cell size in the X direction |
|
YINC1 |
No |
Parent cell size in the Y direction |
|
ZINC1 |
No |
Parent cell size in the Z direction |
|
NX1 |
No |
Number of parent cells in the X direction |
|
NY1 |
No |
Number of parent cells in the Y direction |
|
NZ1 |
No |
Number of parent cells in the Z direction |
The default values of fields XPPPC, YPPPC and ZPPPC in the input POINTS file show the number of points per parent cell in each direction as specified for the SGSIM process. In terms of the model these correspond to the number of subcells per parent cell. Hence the first grid point has coordinates X,Y,Z where:
X = XMORIG1 + 0.5*XINC1/XPPPC Y = YMORIG1 + 0.5*YINC1/YPPPC Z = ZMORIG1 + 0.5*ZINC1/ZPPPC
The number of points per parent cell may be changed by defining the parameters XPPPC, YPPPC and ZPPPC. If these parameters are undefined or set to zero, then the default field values from the input POINTS file are used. If these parameters are given positive values, then these values redefine the number of points per parent cell.
The GRADE values for each realization are averaged (arithmetic mean) over each parent cell.
Output SIMMOD file
The output SIMMOD file is a block model containing the average GRADE value per realization for each cell. The model will only include parent cells - no subcells. The fields containing the simulated grades are named SIM1, SIM2, SIM3, ... for realization 1, 2, 3, ... Therefore the number of realizations that can be stored in a file is limited as described in the "Program Limits" section below.
| Field |
Stored |
Description |
|
IJK |
Yes |
IJK index |
|
XC |
Yes |
X coordinate of centre of parent cell |
|
YC |
Yes |
Y coordinate of centre of parent cell |
|
ZC |
Yes |
Z coordinate of centre of parent cell |
|
NPTS |
Yes |
Number of subcells (simulated points) averaged into a parent cell * |
|
SIM1, SIM2... |
Yes |
Simulated values |
|
SIMn |
Yes |
nth simulated value |
|
ETYPE |
Yes |
The average of all the SIMi values |
|
XINC |
Yes |
Parent cell size in the X direction |
|
YINC |
Yes |
Parent cell size in the Y direction |
|
ZINC |
Yes |
Parent cell size in the Z direction |
|
XMORIG |
No |
X origin of model |
|
YMORIG |
No |
Y origin of model |
|
ZMORIG |
No |
Z origin of model |
|
NX |
No |
Number of parent cells in the X direction |
|
NY |
No |
Number of parent cells in the Y direction |
|
NZ |
No |
Number of parent cells in the Z direction |
* If there are no absent data grade values then the number of subcells averaged into a parent cell will be XPPPC*YPPPC*ZPPPC. However if there was insufficient data to simulate all points then NPTS will be less than this value.
Output STATMOD file
The output STATMOD file is a block model containing the statistical parameters of the distribution of average realizations for each cell. It has the same model parameters as the output SIMMOD file.
| Field |
Stored |
Description |
|
IJK |
Yes |
IJK index |
|
XC |
Yes |
X coordinate of centre of parent cell |
|
YC |
Yes |
Y coordinate of centre of parent cell |
|
ZC |
Yes |
Z coordinate of centre of parent cell |
|
NSAMPLES |
Yes |
The number of realizations |
|
MINIMUM |
Yes |
Minimum grade |
|
MAXIMUM |
Yes |
Maximum grade |
|
MEAN |
Yes |
Arithmetic mean grade |
|
VARIANCE |
Yes |
Variance |
|
STANDDEV |
Yes |
Standard deviation |
|
STANDERR |
Yes |
Standard error |
|
SKEWNESS |
Yes |
Skewness - the degree of asymmetry. Zero for normal distribution. |
|
KURTOSIS |
Yes |
Kurtosis - the degree of peakedness. Zero for normal distributon. |
|
NPTS |
Yes |
Number of subcells (simulated points) averaged into a parent cell |
|
PC2.5, PC10... |
Yes |
Percentiles (See quantiles) |
|
GA0 |
Yes |
Grade above cutoff of 0g/t (See cutoffs) |
|
GB0 |
Yes |
Grade below cutoff of 0g/t |
|
PA0 |
Yes |
Proportion above cutoff of 0g/t |
|
GA0.5 |
Yes |
Grade above cutoff of 0.5g/t |
|
GB0.5 |
Yes |
Grade below cutoff of 0.5g/t |
|
PAX.X |
Yes |
Proportion above cutoff of X.Xg/t |
|
GA9 |
Yes |
Grade above cutoff of 9g/t |
|
GB9 |
Yes |
Grade below cutoff of 9g/t |
|
PA9 |
Yes |
Proportion above cutoff of 9g/t |
|
XINC |
Yes |
Parent cell size in the X direction |
|
YINC |
Yes |
Parent cell size in the Y direction |
|
ZINC |
Yes |
Parent cell size in the Z direction |
|
XMORIG |
No |
X origin of model |
|
YMORIG |
No |
Y origin of model |
|
ZMORIG |
No |
Z origin of model |
|
NX |
No |
Number of parent cells in the X direction |
|
NY |
No |
Number of parent cells in the Y direction |
|
NZ |
No |
Number of parent cells in the Z direction |
Quantiles
Each cell includes the percentile values as defined by the PERCENT field in the QUANTILE file or by the QUANTILE parameter. For example if the QUANTILE file contains the 5 records shown below, then the 5 fields PC2.5, PC10, PC50, PC90 and PC95 are created giving the 2.5 percentile, the 10 percentile, etc. The minimum simulated GRADE value is the 0 percentile and the maximum is the 100 percentile. These are recorded in the MINIMUM and MAXIMUM fields respectively. Linear interpolation between the actual values is used to calculate the percentiles.
| PERCENT |
| 2.5 |
| 10 |
| 50 |
| 90 |
| 95 |
If a QUANTILE file is not specified then the quantiles are specified using the QUANTILE parameter which defines the number of percentiles minus 1. For example if QUANTILE = 5 then the 4 percentiles 20%, 40%, 60%, 80% are calculated; if QUANTILE = 8 then the 7 percentiles 12.5%, 25%, 37.5%, 50%, 62.5%, 75%, 87.5% are calculated. If QUANTILE = 2, the minimum, then just the 50% is calculated ie the median.
Cutoffs
If cufoffs are specified using either the CUTOFF file or the CUTOFF parameter then 3 extra fields per cutoff will be created in the output STATMOD file. The names of the 3 fields have the format:
|
Field |
Description |
Example |
|
PAxxx |
Proportional of cell above or equal to cutoff xxx |
PA3.4 |
|
GAxxx |
Grade of cell above or equal to cutoff xxx |
GA3.4 |
|
GBxxx |
Grade of cell below cutoff xxx |
GB3.4 |
The proportion above cutoff (PA) is the number of realized grade values above cutoff divided by the total number of realizations. The grade above cutoff (GA) is the average of those realizations above cutoff, and the grade below cutoff (GB) is the average of those realizations below cutoff. Hence:
GA * PA + GB * (1 - PA) = Mean grade of realizations in a cell.
Output RESERVES file
The RESERVES file includes the following fields and includes one record per cutoff:
|
Field |
Description |
|
CUTOFF |
Cutoff grade |
|
PRABOVE |
Proportion of the model above cutoff |
|
TONABOVE |
Tonnes above cutoff |
|
GRDABOVE |
Grade above or equal to cutoff |
|
GRDBELOW |
Grade below cutoff |
|
METABOVE |
Metal above cutoff (GRDABOVE*TONABOVE) |
This gives the average values over all cells in the model. If the RESCSV parameter is set to 1 then the file will also be output as a CSV file so that it can be read directly into Excel.
Output PLOT files
Up to 4 plot files can be created showing:
|
X Axis |
Y Axis |
|
Cutoff Grade |
Grade above cutoff |
|
Cutoff Grade |
Tonnes above cutoff |
|
Cutoff Grade |
Metal above cutoff |
|
Cutoff Grade |
Tonnes above cutoff (left axis) |
The plots are created directly from the RESERVES file. These are standard Datamine plot files that can be displayed using Tools | Display Plot File command. Example are given at the end of this section.
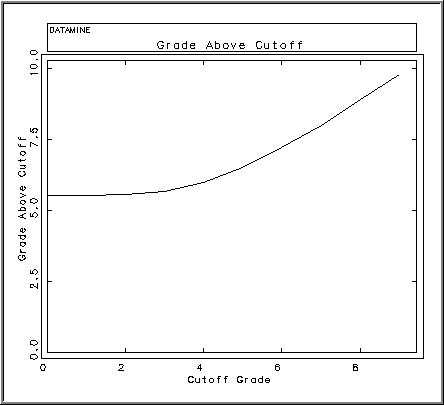
An example of a plot file displayed in the Graphics window, output from CSMODEL
The maximum length of the PLOT file name cannot be greater than 18 characters.
Program Limits
-
Maximum number of quantiles = 30
-
Maximum number of decimal places defining quantile = 2
-
Maximum number of cutoff grades = 16
-
Maximum number of digits (including the decimal point) defining cutoff grades = 6
-
Maximum number of decimal places defining cutoff grades = 2
|
Number of Decimals |
Maximum Cutoff |
|
0 |
999999 |
|
1 |
9999.9 |
|
2 |
999.99 |
Note: The maximum number of fields in a legacy .dm file is 256 and for a .dmx file is 2048. See Datamine File Formats.
The SIMMOD file has 13 model fields and uses 7 temporary fields. Hence if an output SIMMOD file is selected the maximum number of realizations for the single precision version is restricted to 44; for the double precision version 200 are allowed.
The number of fields in the output STATMOD file consists of:
|
Description |
Number of Fields |
|
Model fields |
13 |
|
Statistics fields |
10 |
|
Quantile fields |
Q |
|
Cutoff fields |
3C |
Q is number of quantiles defined in the file or by parameter and C is the number of cutoffs. The total number of fields must be less than 64 (single precision) or 256 (double precision).
System Files
|
_csmlog.txt |
Log file. Only useful if there is a problem. |
|
_csm_*.txt |
Temporary system files. These will be deleted if the process terminates cleanly. |
|
_csm01.mac |
Temporary macro file. |
|
_sp*.dm |
Temporary Datamine files. These will be deleted if the process terminates cleanly. |
All files matching the template _csm_*.txt and _sp*.dm will be deleted as the process terminates. Therefore you should not use any of these file names for your own work.
Input Files
|
Name |
Description |
I/O Status |
Required |
Type |
|
POINTS |
Input points file containing simulated points as created by SGSIM. This must include the coordinate fields XPT, YPT, ZPT, the grade field GRADE and the simulation (realization) number field SIMNUM. It must also include the implicit fields XMORIG1, YMORIG1, ZMORIG1, XINC1, YINC1, ZINC1, NX1, NY1, NZ1 defining the grid origin, size and number of points, as well as the fields XPPPC, YPPPC, ZPPPC defining the number of points per parent cell for the output model. The default value of SIMNUM must be set to the number of realizations. These implicit fields will have been added automatically by the process SGSIM . |
Input |
Yes |
Point Data |
|
QUANTILE |
Input file containing list of percentile values defined using field PERCENT. The GRADE value corresponding to each PERCENT value is included in the output STATMOD file. The maximum number of percentiles defined in the file is 30. If a QUANTILE file is not specified then percentiles at equal intervals can be defined using parameter QUANTILE . |
Input |
No |
Table |
|
CUTOFF |
Input file containing list of cutoff grades defined using field COGRADE. The proportion of each cell above cutoff, the grade above cutoff and the grade below cutoff are calculated and written to the STATMOD file. The maximum number of cutoffs defined in the file is 13 (single precision) or 16 (double precision). If a CUTOFF file is not specified then a single cutoff can be defined using parameter CUTOFF . |
Input |
No |
Table |
Output Files
|
Name |
I/O Status |
Required |
Type |
Description |
|
SIMMOD |
Output |
No |
Block Model |
Output block model file containing the simulated GRADE values for each cell and each realization. The values are calculated by averaging the simulated points lying within the cell according to the number of points per cell defined by the XPPPC , YPPPC and ZPPPC parameters. The SIMMOD file can be the same as the STATMOD file. Although SIMMOD and STATMOD are both optional, at least one of the two must be defined. |
|
STATMOD |
Output |
No |
Block Model |
Output block model file containing statistical parameters for each cell. The value of each cell for each realization is calculated by averaging the simulated points lying within the cell (as defined by the XPPPC , YPPPC and ZPPPC parameters) and then statistics (mean, variance, etc) are calculated for the simulated cell values for each cell. The statistics are stored in the STATMOD file. The STATMOD file will also includes the percentile values as defined by the QUANTILE file or the QUANTILE parameter, and the proportion and grade of each cell above cutoff for cutoffs defined by the CUTOFF file or the CUTOFF parameter. The STATMOD file can be the same as the SIMMOD file. Although SIMMOD and STATMOD are both optional, at least one of the two must be defined. |
|
RESERVES |
Output |
No |
Table |
Output file containing total tonnes above cutoff, grade above cutoff and grade below cutoff for those cutoffs defined by the CUTOFF file or the CUTOFF parameter. The four fields in the RESERVES file are CUTOFF, TONABOVE, GRDABOVE and GRDBELOW. If a RESERVES file is specified then the STATMOD file must also be defined. If parameter FULLCELL=1 then the tonnes and grades apply to the EType estimate for parent cells. The EType is a smoothed estimate and does not therefore correctly represent the recovered values for Selective Mining Units (SMUs). If FULLCELL=0 then the tonnes and grade give the average of the values for individual simulations. This represents the values for SMUs equal to the parent cell size. |
|
PLOT |
Output |
No |
Plot |
Template name for output plot file(s) showing tonnes, grade and/or metal above cutoff (Y axis) against cutoff (X axis). The PLOT file template name should be a maximum of 18 characters. One or two characters are added to this name to create the actual file name, as follows:
The parameters GPLOT , TPLOT , MPLOT and GTPLOT define which plots to create. A minimum of 2 cutoffs must be defined and a STATMOD file specified in order for the PLOT file(s) to be created. |
Fields
|
Name |
Description |
Source |
Required |
Type |
Default |
|
GRADE |
Field in the input POINTS sample file defining the simulated grade. |
POINTS |
Yes |
Numeric |
Undefined |
Parameters
|
Name |
Description |
Required |
Default |
Range |
Values |
||||||
|
XPPPC |
Number of simulated points in the X direction to be averaged into a parent cell. If set to 0 then the value of the XPPPC parameter used by command SGSIM for creating the POINTS sample file will be used. This value is stored as the default value of the XPPPC field in the POINTS file. |
No |
0 |
0,200 |
Undefined |
||||||
|
YPPPC |
Number of simulated points in the Y direction to be averaged into a parent cell. If set to 0 then the value of the YPPPC parameter used by command SGSIM for creating the POINTS sample file will be used. This value is stored as the default value of the YPPPC field in the POINTS file. |
No |
0 |
0,200 |
Undefined |
||||||
|
ZPPPC |
Number of simulated points in the Z direction to be averaged into a parent cell. If set to 0 then the value of the ZPPPC parameter used by command SGSIM for creating the POINTS sample file will be used. This value is stored as the default value of the ZPPPC field in the POINTS file. |
No |
0 |
0,200 |
Undefined |
||||||
|
FULLCELL |
Flag to show whether the RESERVES files and plots are to be created using full (1) or partial cell evaluation.
|
No |
1 |
0,1 |
0,1 |
||||||
|
QUANTILE |
The number of percentiles minus 1 to be calculated and output in the STATMOD file. For example if QUANTILE = 5 then the 4 percentiles 20%, 40%, 60%, 80% are calculated; if QUANTILE |
No |
2 |
2,30 |
Undefined |
||||||
|
CUTOFF |
The cutoff grade. The proportion of each cell above cutoff, the grade above cutoff and the grade below cutoff are calculated and written to the STATMOD file. If more than one cutoff is required then multiple cutoffs can be specified in the CUTOFF file. If a CUTOFF file is specified then the CUTOFF parameter will be ignored. |
No |
Undefined |
Undefined |
Undefined |
||||||
|
DENSITY |
Density. This used for calculating tonnes above cutoff. |
No |
1 |
Undefined |
Undefined |
||||||
|
RESCSV |
Flag to show whether the RESERVES file should be created as a CSV file as well as a Datamine file, so that it can be read directly into Excel. The name of the CSV file will be the same as the Datamine file but with the extension .csv.
|
No |
0 |
0,1 |
0,1 |
||||||
|
GPLOT |
Flag to indicate whether a plot of grade above cutoff v cutoff should be created. The name of the plot file is defined by the plot file template PLOT , with the additional character G. A minimum of 2 cutoffs must be defined and a STATMOD file specified in order for the plot file to be created.
|
No |
0 |
0,1 |
0,1 |
||||||
|
TPLOT |
Flag to indicate whether a plot of tonnes above cutoff v cutoff should be created. The name of the plot file is defined by the plot file template PLOT , with the additional character T. A minimum of 2 cutoffs must be defined and a STATMOD file specified in order for the plot file to be created.
|
No |
0 |
0,1 |
0,1 |
||||||
|
MPLOT |
Flag to indicate whether a plot of metal above cutoff v cutoff should be created. The name of the plot file is defined by the plot file template PLOT , with the additional character M. A minimum of 2 cutoffs must be defined and a STATMOD file specified in order for the plot file to be created.
|
No |
0 |
0,1 |
0,1 |
||||||
|
GTPLOT |
Flag to indicate whether a plot of grade above cutoff v cutoff and tonnes above cutoff v cutoff should be created on the same plot. The name of the plot file is defined by the plot file template PLOT , with the additional characters GT. A minimum of 2 cutoffs must be defined and a STATMOD file specified in order for the plot file to be created.
|
No |
0 |
0,1 |
0,1 |
Example
!CSMODEL &POINTS(simpts2),&CUTOFF(cutoff1),&SIMMOD(simmod1),
&STATMOD(statmod1),&RESERVES(reserve1),&PLOT(gtplot),
*GRADE(AU),@XPPPC=2.0,@YPPPC=2.0,@ZPPPC=2.0,
@QUANTILE=2.0,@DENSITY=2.5,
@GPLOT=1,@TPLOT=1,@MPLOT=1,@GTPLOT=1
Related topics and activities