
Preview Downhole Columns in Plots
The distinction between static and dynamic drillholes is important when applying overlay formatting; in-memory dynamic drillhole data will be listed as "Dynamic Drillholes" in the Format Display overlays list, and can be formatted in the same way as a static (file-based) drillhole object. Static drillholes are represented (by default) with the name of the underlying data object.
An example of the previewer showing 4 left-aligned (non-overlapping) columns
When a drillhole overlay (static or dynamic) is highlighted, the area on the right of the Format Display dialog will update to show a Style and Drillholes tab.
The Drillholes tab features a preview area to help identify the positions of existing downhole columns. The position of these columns can be rearranged as required using a simple drag-and-drop interface. This indicates the relative position of downhole columns for the target overlay.
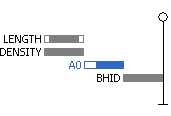
In the centre of the previewer, the vertical line represents the position of the drillhole trace. Other columns (representing attribute values) display in relation to this origin. For newly-created drillhole objects, the previewer only displays the central drillhole indicator (complete with collar and end-of-hole symbols).
Viewing Margins
All downhole columns that have specific margin settings will be formatted to show the left/right margin widths at the scale they have been set. Margins for each column are independently configured using the Format Column screen, for example:
The overall width of each column is shown to scale - this can also be adjusted with the Format Column screen. Overlapping items of different widths will always be aligned to the left edge of the column indicators in the same group, for example:
Columns are displayed within the previewer like this:
-
Columns are always drawn according to a left-right rule.
-
The leftmost column will always be drawn at the top.
-
For columns that overlap, data will be drawn in a top-down order.
-
Column widths are indicated and are always drawn to scale.
-
Specific margin settings are shown for each column.
-
No two column indicators can share the same 'row'.
The display contains not only the name and relative position of each column, but also indicates the order in which data is drawn (why is this important? Consider an example where a histogram column is drawn after a line graph in the same alignment - it is possible that the latter may obscure the former). You can re-order the drawing order of columns that overlap by dragging and dropping items into the required vertical layout.
An example of rendered 2D projection downhole columns, arranged via the Previewer
Using the Drillhole Previewer
The following activities show you how to manage downhole columns in 2D plot projections. The procedure is different for dynamic and static drillhole object overlays.
Related topics and activities: