|
|
Ore Zone Boundaries Adding ore zone outline features to your plot |
Adding ore zone boundaries
-
Activate theManageribbon and chooseSelect | Method | Table Interval to turn on sample snap mode.
-
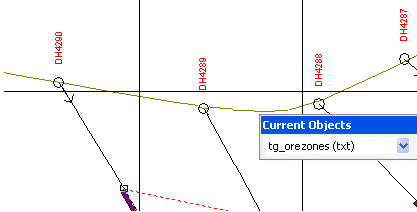
Select the Intersections table in the Current Objects toolbar box.
-
Activate theManageribbon and chooseInsert | Geology | Ore Zone Boundary
-
Starting from one side of the view, click top of an intersection to outline the entire zone:

-
Continue in sequence across the view and outline the entire zone, repeat and select the base of each intersection, ending at the start point.
-
Right-click and choose Apply to finish the outline:

-
To insert points into the outline, choose Edit | Edit Points and click on a line segment between two points and drag the inserted point to the desired location. Click again to position.
-
Repeat until editing is completed and then right-click and choose Apply to exit edit points mode:

|
|
You can use any of the view commands and window slide bars while digitizing without interrupting edit mode. |
To format the display of outlines
-
Activate thePlots Viewribbon and selectFormat | Overlays to display the Format Display dialog.
-
Select the Ore Zones overlay in the list of overlays to display the current format settings.
-
Choose the Style tab and select Lines.
-
Choose the Color tab to select either a Fixed color, or choose a Field (column) and color Legend to apply to the selected field. Check the Fill option to color-fill polygons.
-
Choose the Labels tab to annotate the outline with field values.
-
Choose Apply to apply the changes or choose OK to apply changes and close the dialog.
|
|
Related Topics |
|
|
Insert,
edit or delete features |


