|
|
Ellipsoid Properties - General Dialog An explanation of fields and properties |
Ellipsoid Properties - General Dialog
To access this dialog:
-
From the Sheets Control Bar (currently-active 3D window sub-folder), open the Ellipsoids folder. This will display the loaded ellipsoids. Right-click an ellipsoid object and select Properties. This will display the Ellipsoid Properties dialog. Select the General tab.
-
Double click an ellipsoid object in the Sheets | currently-active window | Ellipsoids sub-folder. Select the General tab.
-
Double click a visible 3D ellipsoids object in the currently-active 3D window.
This dialog is used to define how ellipsoid data is displayed in the 3D window.
Field details:
Name: displays the current name of the selected data object overlay. You can edit this name and click OK or Apply to change the model file name within the project. Note that editing the name of a 3D object will not affect the description assigned to the underlying (Source) file - see below. You can edit this if you like, which is the same as using the Sheets control bar menu's Rename option.
Source: shows the name of the loaded object from which the current 3D overlay was derived.
Color: allows you to define the color of data using a standard fixed color, or a display legend that references their associated data attributes.
Fixed: set this option to select a standard fixed color from the adjacent dropdown list for all lines in the object. If the Legend option is selected, then this color is also used to color data that cannot be matched to a legend interval.
Legend: allows you to select a predefined, system standard or user-created legend. Any data that cannot be matched to a legend interval is colored using the color shown in the Fixed dropdown list.
Column:
after selecting a legend, use theColumndrop-down list to select a data
field containing color values to be matched to the legend. Only fields
relevant to the currently-selected legend are shown. Common to
all legend dropdown lists, once a legend has been selected, it can
then be displayed or edited. A default legend can also be created
automatically for any selected field.
|
|
Show the currently-selected legend intervals and display properties. |
|
|
Edit the currently-selected legend using the Legends Manager dialog. |
|
|
Select a default legend for the selected data column if one already exists, or if no default legend is available, the Create New Legend wizard will appear to let you create a new legend. |
|
|
The color selected in the Fixed dropdown list is used whenever a value cannot be found for a selected legend and column. |
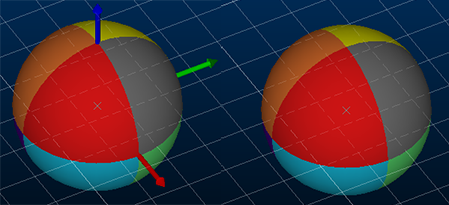
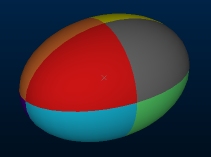
Octants: the default colouring option for ellipsoids. If selected, each quadrant of the ellipsoid is coloured independently, making orientation more obvious. the default colouring option for ellipsoids. If selected, each quadrant of the ellipsoid is coloured independently, making orientation more obvious. This will also cause any displayed axis indicators to be displayed in red, green and blue (see below).
Display axis indicators:
show or hide axis indicators on all ellipsoids within the target object. In the image below, indicators are enabled for the left image and disabled for the right:
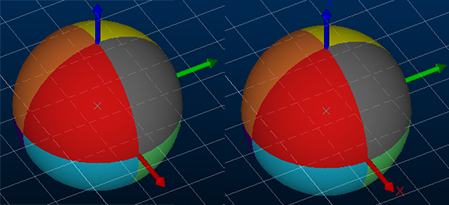
Display axis labels: only available if Display axis indicators is enabled, you can either show or hide axis labels for all ellipsoids in the target object using this check box:
You can also change the Size of the labels if you wish.
Opacity: allows you to increase the opacity of the ellipsoid object by dragging the slider to the right, or to the left for increased transparency.
|
|
Related Topics |
|
|
Points Properties Dialog - SymbolsTabPoints Properties Dialog - Labels TabAssociated Files TabInfo Mode List Tab |


