
Level Map Features
For general information on map feature digitizing and configuration, see Map Features.
Level map data is always digitized directly into the 3D World view.
Level Map Features
Whilst face and level mapping features are captured in similar circumstances, digitizing features onto a level map differs from a face map in the following ways:
-
Features are digitized in world coordinates, in relation to imported survey data. No georeferencing occurs.
-
Features, and any digitized map data (including comments and sketches) are digitized either:
-
Onto the level map plane (meaning all data exists at the same level), or;
-
Onto the level indicated by the survey data. This allows the mapped data to follow the elevation profile of the surveyed strings or points.
Note: contacts and polygons digitized in this way can potentially be used for downstream modelling and evaluation, not just for reporting purposes.
-
-
Level map features can be projected to either the map plane or the survey data elevation profile at any time, using the Survey panel's draping options.
Level Map Outlines
Outlines can be generated from wireframe, face and level map feature data.
Why generate outlines? Outlines are a special type of string. Always closed, they indicate, typically, the boundary of one or more string objects. It can be useful to assess the area of these strings (using query-string) and formatted outlines can be a useful way of visualizing a particular mining area.
When creating a face map, outlines are always created on the same plane, that is, their enclosed shape is flat.
Level mapping, however, allows outlines to be generated that are either flat (on section) or following the shape of the elevation profile of the imported survey data, typically representing backs.
Generally, level outline feature creation is performed like this:
-
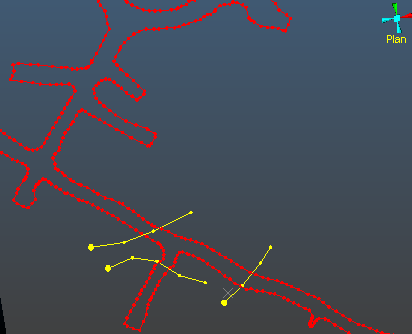
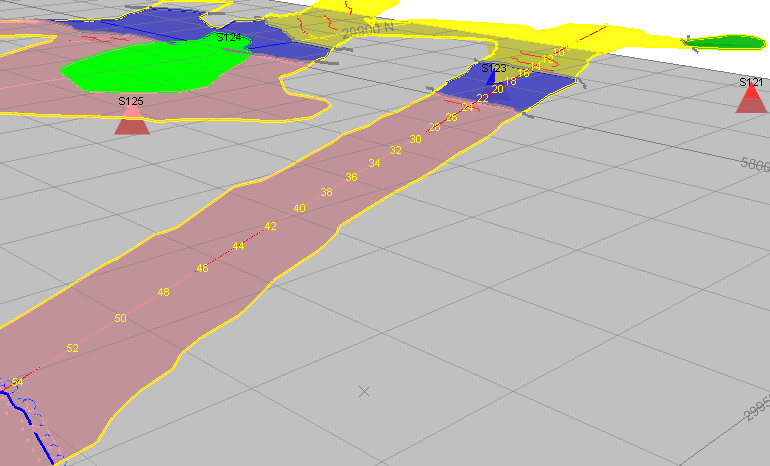
Display the data that clearly demonstrates a bounded area of data, for example, like the drive strings below intersected with two structural contacts representing the limits of a sandstone structure:
-
Activate the Draw (Features) ribbon and select Outlines >> Generate.
-
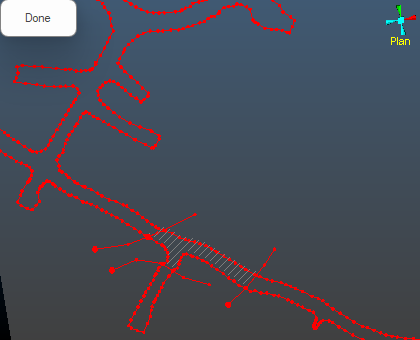
Click inside the enclosed area of the back survey strings. A hatched area appears, indicating outline generation has been successful:
-
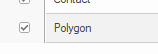
A Polygon map item is added to the level map feature collection:
This polygon can be used to enhance report display, used for area calculations and can also be used as a perimeter for other operations such as block model evaluation.
Level Map Feature Draping
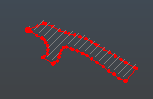
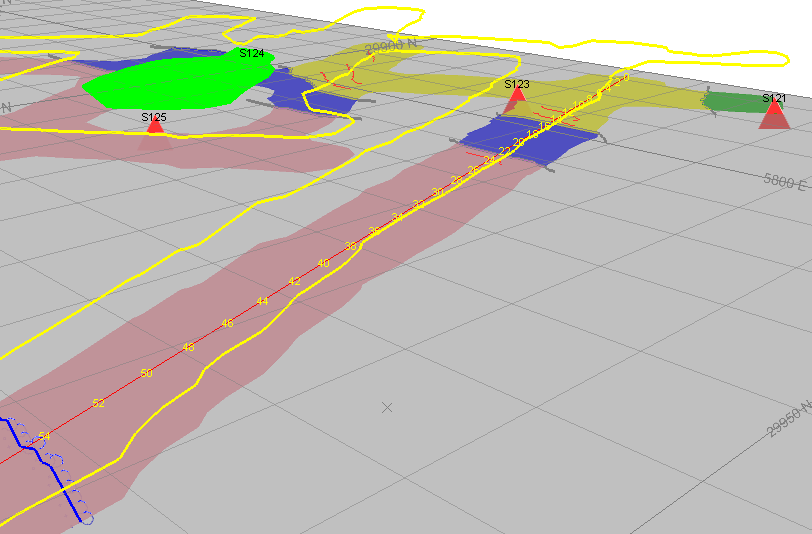
As an example, the image below shows mapped outline data 'draped' to the elevation of the imported survey strings on a level map:
If draped to the map section, mapped outline data appears like this:
Note: the draping options available to you are determined by your system configuration file.
Feature Strike Direction
Mining geologists often measure the azimuth and dip of structures exposed in underground excavations using a specialised compass. It is possible to edit an existing feature strike direction by making use of a system _AZIMUTH field, and to edit the corresponding dip direction using a system _AZIPL90 field.
You (or your system implementer) can expose these fields to the Features panel of the Mapping Task Bar via the system configuration file. This allows you to change the overall strike direction and dip direction of the string quickly and easily, either at the face or back at the office.
For example, you could extend a feature object's configuration using the following attribute definition syntax:
<Attribute>
 <ColumnLabel>STRIKE</ColumnLabel>
 <FieldName>_AZIMUTH</FieldName>
 <EntryProperties>
   <Type>NUMERIC</Type>
   <Minimum inclusive="TRUE">0</Minimum>
   <Maximum inclusive="TRUE">360</Maximum>
 </EntryProperties>
</Attribute>
<Attribute>
 <ColumnLabel>DIPDIRECTION</ColumnLabel>
 <FieldName>_AZIPL90</FieldName>
 <EntryProperties>
   <Type>NUMERIC</Type>
   <Minimum inclusive="TRUE">0</Minimum>
   <Maximum inclusive="TRUE">360</Maximum>
 </EntryProperties>
</Attribute>
The clever bit is the _AZIMUTH and _AZIPL90 field definition. These are reserved system fields that allow you to view and set the overall azimuth/strike and dip direction of the target feature string. Once set, the feature rotates until the target values are reached.
Note: Point features cannot be edited using these system fields.
Related topics and activities