
Quick Start - Back at the Office

This topic is part of the Studio
Mapper Quick Start Guide.
Time at the face can be limited, so it makes sense to do as much as you can in less time-sensitive surroundings either before you go or when you get back from the face. Once map data has been captured and you're reconnected to your office network, Studio Mapper provides a range of tools to convert your field data into georeferenced data ready for downstream modelling and reporting.
The following tasks are covered in this section:
-
Georeference the map data captured at the face.
-
Adjust or reset georeferencing to fine-tune the geolocation of your face data.
-
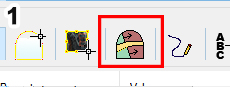
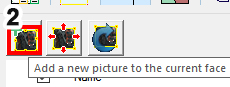
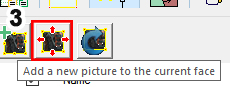
Add an image to your map if you captured one at the face and haven't added it yet.
-
Add channel sample information, including QA/QC samples, if required.
-
Generate a report using a predefined reporting template.
| Georeference the Face Map
Georeferencing isn't relevant to level mapping as data is digitized in world coordinates. See Create a Level Map. |
|||
|
|
|
|
|
If required, load reference data into the 3D World window. This data can be loaded from anywhere accessible to your PC.
|
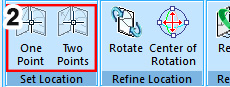
Select the map you wish to georeference and select a georeferencing method (Georeference ribbon), e.g. One Point or Two Points. |
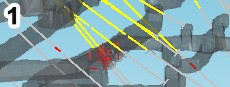
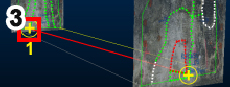
Click either one or two reference points on the map, within the Map window. |
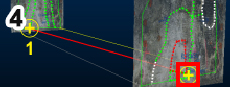
Select the corresponding point or points in the 3D World window.
|
|
If the reference data (drive strings or wireframes, drillholes etc.) is already part of your project, you can see it in the Project Data control bar (Other Files folder). |
Georeferencing will assign real world coordinates to your map and all the data it contains. Georeferenced maps can still be viewed in a map window and edited like a non-georeferenced map in local coordinates. Map data is commonly georeferenced with reference to reference data, such as shot point locations and or drive strings/wireframes.
|
One point location will position a map at a zero azimuth in the 3D World window, but this (and the dip and roll) can be adjusted afterwards. Two point location lets you define an azimuth in the 3D World window, and you can subsequently define the dip and roll, if required, using adjustment controls. The Status bar will show you what input Studio Mapper is expecting next. |
You can define your world coordinates interactively with the cursor, or using the command line to enter specific actual or relative coordinates. For example, if using the One Point method and you wish for your map to be located at 2500, 3500, -300, you can select the control point in the map window, swap to the 3D window and enter "2500, 3500, -300" into the Command toolbar. Pressing <Enter> completes the command, positioning the map at 2500, 3500, -300 with a zero azimuth, dip and roll. |
|
Adjust or Reset Face Map Georeferencing Georeferencing isn't relevant to level mapping as data is digitized in world coordinates. See
Create a Level Map. |
|||
|
|
|
|
|
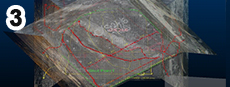
If you need to adjust the current orientation of a georeferenced map, activate the 3D World window and select a georeferenced map. |
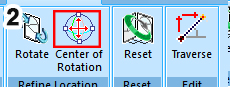
If you need to, set the centre of adjustment on the map using the Center of Rotation button on the Georeference ribbon. |
Select the Rotate command to display the map rotation controller.
|
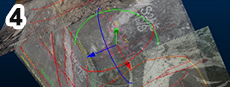
Left-click and drag the rotation controller segments to adjust the azimuth, dip and/or roll as required. |
|
Georeferencing can be adjusted on any map that has been georeferenced. The adjustment controls are not available if a map is displayed in local coordinates, in a Map window. |
By default, rotation adjustment is performed using the center of the map as the rotation point. The current rotation point is shown as a yellow circle symbol when the Center of Rotation option is selected. |
The rotation controller will be centered on your rotation point. Each of the coloured segments represents an adjuster for azimuth, dip or roll. |
Rotation is performed in real time by mouse movement, but you can fine-tune the final orientation of the map afterwards (or instead, if you know what the Azimuth, Dip and Roll values should be) using the Map Properties panel |
| Add Channel Sample Area(s)
Channel sample areas are only relevant if channel samples have been digitized (see above). |
|||
|
|
|
|
|
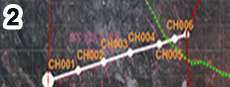
Select the map and face containing the channel sample and activate the Areas tab on the Mapping Task Bar. |
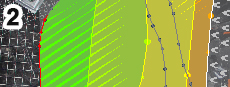
Digitize area boundaries, either as open strings (for the creation of outlines later) or closed polygons. Areas should contain one channel sample center, or more if area-weighting is relevant. |
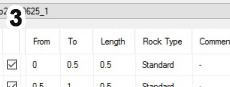
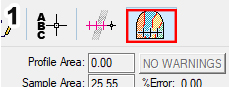
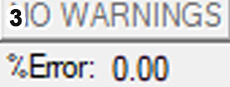
Review the %Error value to see if the profile/sample area discrepancy exceeds the permitted value. Review any WARNINGS and resolve area layouts accordingly. |
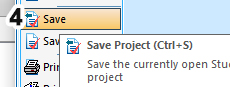
To commit your channel sample area information to your mapping database for the selected map, Save your project. |
|
The Areas tab will only appear
(and will only show up on the Home ribbon) if the appropriate
configuration settings have been applied to your system. |
You can digitize and edit areas using any of the provided editing tools. Providing the areas (strings) object is current, subsequent string edits will dynamically update the area values in the Mapping Task Bar - useful for fine tuning. |
There will either be a WARNINGS or NO WARNINGS button. If the former, clicking it will display useful summary information in the Output control bar, e.g. if sample centers lie outside an area, or if multiple sample centers were found and so on. |
Channel sample data files will be appended with area information and can be exported to other systems, such as Studio RM, for well-informed resource modelling later. |
| Generate a Report | |||
|
|
|
|
|
|
Select the map relating to your report.
|
Activate the Map ribbon and select Report | PDF |
Select a location and report file name. |
Review and issue the report |
|
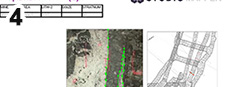
Map data is incorporated into a PDF report via a template that is specified in your system configuration file. Mapped faces are included in a reporting/plot template as a projection plot item. More about report templates... |
PDF output is generated using your default PDF 'printer' and displayed using your default PDF viewing application. Please note that Datamine cannot provide technical support for your PDF driver or viewer application.
|
Reports are named using a standard convention that incorporates the map name, although you can change this to whatever you like. |
Reports are generally lightweight and can be easily distributed by email. |
| Export Mapping Data |
|||
|
|
|
|
|
Once mapping and editing is complete, perform a final review of all georeferenced maps and faces, using the Mapping Task Bar. Reference data won't be exported, but it may help to display it to ensure maps and associated feature are geolocated as you expect. |
Activate the Home ribbon and select the Export command. This displays the Export map data to external files dialog. |
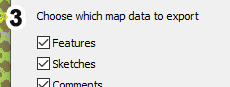
Choose the Mine and Area containing the data you wish to export. Choose the type of data you want to export. By default, all features, sketches, comments and channel sample data will be exported (as separate data files).
|
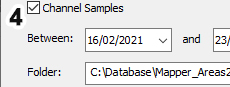
Choose where you wish to export your data (e.g. a local or network folder location) Also choose the date range between which data will be exported. Click Export. |
|
The Export function will include all 3D mapped data, including whichever of the following are useful: features, sketches, comments and channel samples (potentially including area information). Once export is complete, subsequent changes to the map data may need to be re-exported. |
It isn't necessary to pre-select a map/face to export data; all data for the selected mine and area will be exported, regardless of whether it is displayed or not. |
Data will be exported as potentially multiple files, one for each map data type. Typically, data will be used in downstream modelling, for example, using feature strings as extra points in implicit vein modelling, or using channel sample data in grade estimation. |
Exporting data does not affect your currently connected database contents, unless you choose to export to a sub-folder within it (not generally recommended). The specified data range will be used to include only data with a qualifying date stamp (according to the value embedded when the map data was created and not the operating system last modified date). Channel sample data, if exported, will also be exported in .csv format. Data will be exported as Datamine binary format (.dm) but can be converted to other formats using Datamine's Data Source Drivers facilities.
|