
Define Grade Curves
To access this screen:
-
Using the Tasks Pane's Reports command group, select Custom >> Grade Curves.
Grade curve reports show ore type tonnages classified by grades of mineral elements for a selected pit shell (surface). A curve grade report can include one or more report items where each item represents one grade curve.
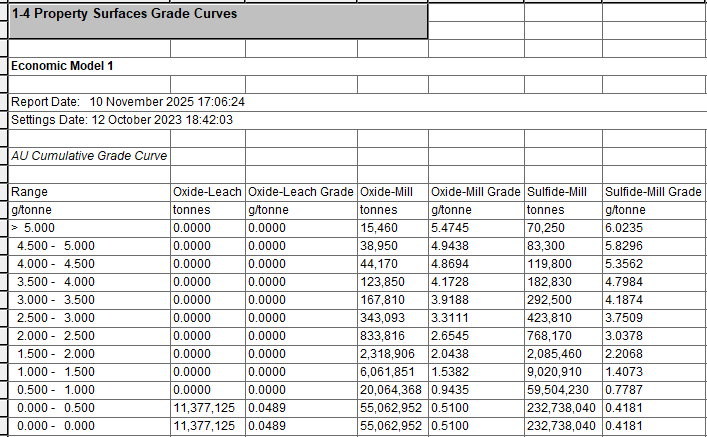
An example of a cumulative grade curve report
To generate grade curves for a selected pit shell:
-
Display the Define Grade Curves screen.
-
Expand Generate grade curves for to pick a surface file.
-
Select the range of limiting surfaces using Within Range controls. For example, if a pushback file defines 10 pushbacks and you are only interested in pushback 5's grade curves, enter
5as First pit code and5as Last pit code. -
Add a grade curve to the report using the Grade Curve Properties screen.
-
You can also select an existing grade curve report item and Edit it.
-
Delete any grade curve report items you no longer need.
-
-
Click OK to display the selected item's grade curve report in a new window.
Related topics and activities