
|
|
Dimension Overlays Creating and using dimension overlays |

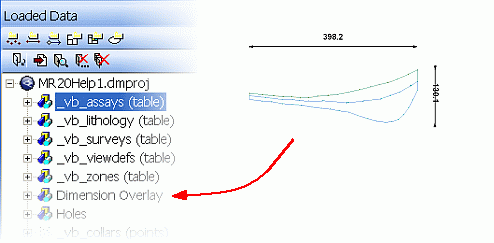
Dimension Overlays are plot features containing one or more dimension lines, displayed by default as arrows, which show 2D or 3D distances between points in a plot sheet. Dimension lines are stored in an overlay linked to an underlying data object. The Dimension Overlay is included in the current list of overlays for the selected sheet and can also be viewed in the Design or 3D windows. Only one Dimension Overlay exists per sheet, listed in the Overlay tree, and like any other overlay can be formatted independently of those on other sheets, using the Format Display dialog. All Dimension Overlay data, in effect string data, is stored in a single Dimension Overlay object, listed in the Data Object Manager) as 'Dimension Overlay'.
|
|
A Dimension Arrow is a plot item that links to two points in the current plot sheet, for the purpose of recording accurate 2D and 3D measurements of distance and angle. The item information is stored in the project file and cannot be accessed outside of the specific sheet in the Plots window. More... |

Adding a New Dimension Overlay
-
In the Plots window, iensure that Normal Mode is set (by toggling theManageribbon andLayout Mode)
-
Select the required plot sheet.
-
Using theManageribbon, select3DDimension Overlayfrom thePlot Itemdrop-down list
-
In the sheet, draw the required line(s), right-click and select Stop Appending Points.
|
|
|
|
|
Related Topics |
|
|