|
|
Histograms - Chart Properties Editing Histogram Chart Parameters |
Histogram Properties
To access this dialog:
-
In the Histogram dialog, Charts tab, select a chart item from the list,
-
Click the Edit Chart Properties icon
 .
.
The Chart Parameters dialog is used to define the histogram bin size, title and grid parameters.
Field Details:
Bin: this group contains the bin controls:
-
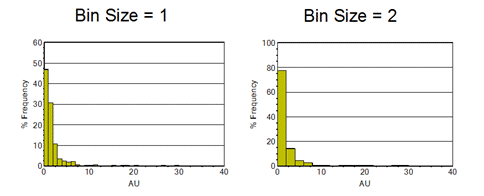
Bin Size: this field defines the overall 'capacity' of each histogram bar. In visual terms, this will represent the overall width of each bar in relation to the X Axis scale (see below).
Using default values, the scale of the Y Axis will be automatically adjusted to ensure that all data will fit on the plot.
|
|
How is the Default Bin Size Calculated? For a Normal chart type, using theScott's choiceformula: Bin Size = 3.5*s/n1/3, where s is the standard deviation and n the number of samples. The bin size value is rounded down to a 'sensible' value. For a Log chart type: Log Bin Size = (Log(Maximum Value) – Log(Minimum Value)) / (Default Number of Bins for the Normal Histogram)
If using a custom bin size, as a general rule of thumb, check the resultant bin size so that when the number of data values is:
|
Display:
-
Display Chart: enable (default) or disable the display of the chart.
Titles: this group contains the title and axes label controls:
-
Title: accept the default or type in a custom description; select a font size from the drop-down.
-
X Axis: accept the default or type in a custom description; select a font size from the drop-down.
-
Y Axis: accept the default or type in a custom description; select a font size from the drop-down.
-
Chart ID: this read-only field represents the automatically-generated index description for the chart.
Legend: tick this box to display a legend box:
-
Title: accept the default or type in a custom description; select a font size from the drop-down.
Comments: tick this box to display comments in a text box:
-
Comments: type in comments; use <Enter> to define multiple lines.
Grid: tick this box to define custom grid parameters:
-
Minimum: X and Y axes minimum values
-
Maximum: X and Y axes maximum values
-
Grid interval: X and Y exes grid interval

The default histogram 'grid' is determined automatically according to the source data and ensures that all data values for the chart in question are displayed within the preview area.
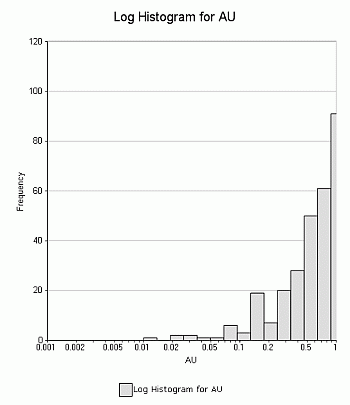
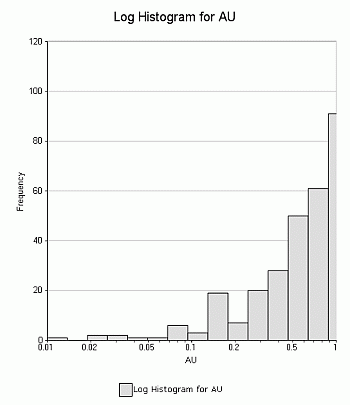
When a custom grid is defined i.e. after the above Grid option is selected, for Log Chart Types, changing the X Axis Minimum and Maximum parameter values will result in an automatic adjustment of the number of displayed grid labels.
This can be seen in the example below where theX Axis MinimumandMaximumparameter values have been changed from '0.001 - 1.0' to '0.01 - 1.0' respectively:


Insert Marker: marker line controls:
-
X Axis Position: define an X axis marker value.
-
Y Axis Position: define an Y axis marker value.
-
Annotate Marker Point: tick this to annotate the XY coordinate of the marker.
|
|
This marker can be used, for example, to indicate the cut off point on a histogram when performing a top cut analysis on a set of sample data. |
Histogram Properties: marker line controls:
-
Apply to all Histograms: tick this box to apply all of the above properties to all the listed histogram charts.
| |
Related Topics |
|
|
Histograms |


