
|
|
Control bars that display results |

Output Control Bars
This section of the interface deals with commands, messages and process results. There are three possible tabs available in this section (although not all may be visible - to make a tab visible use theHomeribbon'sShowmenu to toggle the relevant item(s) on or off.
The output window is a scrollable, dockable window that displays any text output from commands and processes. The output may be cut or copied to the clipboard, or it may be sent to the printer.

Docking the output window
To dock the output window:
-
Right-click the window border to display the popup menu.
-
Clear the Float in Main Window check box and select Allow Docking.
-
The window can be dragged by its title bar to the desired docking position. It will dock automatically when close to the top, bottom or either side of the main window.
|
|
Undocking the window requires the Allow Docking check box to be cleared. |
The following tabs are available in this part of the application:
The Command Control Bar
The Command tab allows you to enter commands or values into your application, either as part of a multi-stage process (e.g. adding sub-cell values when creating a prototype model) or to instigate a command directly (e.g. ESTIMATE).
The command line acts as a direct input device, and if you are aware of the command syntax required, it can often act as a shortcut.
More about the Command control bar...
The Desurvey Report Control Bar
The Desurvey Report window displays information relating to the validation/evaluation of drillhole data, for example, as a result of using the Define Holes command in the 3D window, for example:
More about the Desurvey Report contol bar...
The Optimization Output Control Bar
The Optimization Output tab is used
to display summary information relating to the optimization workflow.
This can include the status of the current optimization run (Optimization Progress view), the
properties of the current planning model (Data
Properties view), information about the current case study
(Case Information view),
the contents and status of the current batch run (Batch
Run Log view and the results of any pushback optimization (Pushbacks Reoptimization view),
e.g.: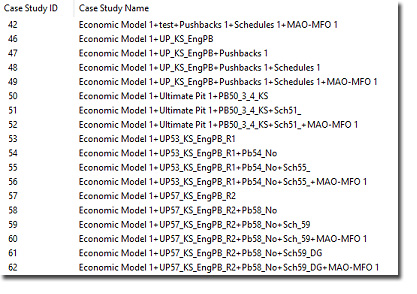
More about the Optimization Output control bar...
The Output Control Bar
The Output tab is used to display useful
information about data objects. For example, selecting a drillhole
will automatically add information to the Output window about the
selected hole, including dimensions, length, zone information e.g:
More about the Output control bar...
|
|
You can rearrange the order that the tabs appear in on the screen by dragging them (hold down the left mouse button when over a tab) to a new position in the tab group. |
The context menu
Right-clicking any of the output windows other than Customization Output displays a context menu allowing you to do the following things:
Field details:
Use subtext if required, but remember to apply the FieldSub class.
Copy: copies the currently highlighted text to the clipboard.
Clear: clears the current window contents. This option is the only option available for the Customization Output control bar.
Select All: selects all available text.
Save As...: you can save the contents of the window to an external file using this command.
Font...: selecting this option displays a font browser allowing you to change the appearance of text in the current window.
Hide: to hide the current window from view, select this option. To enable a hidden window, you will need to set its status using use theHomeribbon'sShowmenu to toggle the relevant item(s) on or off
|
|
Related Topics |
|
|
Hiding, showing and docking tabsCommand Control BarDesurvey Report Control BarOptimization Output Control BarOutput Control Bar |