
Drillholes: Style
To access this screen:
-
Display the Drillholes Properties screen and select the Style tab.
Note: A Datamine eLearning course is available that covers functions described in this topic. Contact your local Datamine office for more details.
The Drillhole Properties: Stylescreen determines how drillhole segments are drawn to the screen in the active 3D window. Various formatting options are on offer, including the addition of 2D or 3D symbols, how the drillhole is rendered (see below), the colours used and other options.
The settings on this screen affect the display of the drillhole data. Other options are available to append the drillhole display with supporting columns down the hole. These are accessed using the Columns tab. See Drillhole Properties: Columns.
Drillholes Properties screen settings affect the current overlay of the loaded drillhole object. The underlying data values of the drillhole are not affected by changes made here.
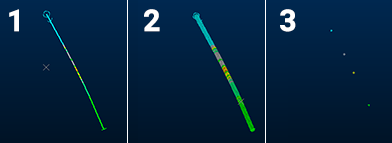
Drillhole Display Types
The basic rendering type for a drillhole can be one of the following:
-
Pixel Line — display the drillhole as a line 1 pixel wide. This can be useful if many drillholes are displayed on screen, or you need to know the precise location of the center of the hole in relation to other reference data (such as a stope wireframe for proximity checking, for example).
-
Default Cylinder — display a 3D cylinder down the hole, of a custom width (which can be set to the value of a variable such as grade, density and so on). This can be often used to good effect in conjunction with a Guideline.
-
Points — display a point for each sample position, either the start, end or center.
Tip: The design command switch-drillhole-points-traces (quick key = "sdpt") toggles between Pixel Line and Points drillhole rendering modes.
Scaling Drillhole Segments
The general procedure for controlling the scale of drillhole segments is as follows
-
Create a base value by setting one of the following options in theSizegroup:
-
Neither column nor legends — the base value is assumed to be '1'. Use the Scale box to set a fixed line width.
-
Legend only — only allowed if the legend is a filter legend. The base value is the line width value of the relevant item in the legend.
-
Column only — the base value is the numeric data attribute in the specified column for the relevant string or edge.
-
Column and Legend — the base value is the line width value of the relevant item in the legend. This is looked up using the data attribute of the relevant string or edge for the specified column (legacy functionality).
-
-
Optionally specify minimum and maximum constraints in the Constraints group.
-
Optionally specify a scale factor In the Scale group. Size values are multiplied by the scale value to produce the final width of the line, taking account of any specified constraints.
To specify the way a drillhole overlay appears in the target 3D window(s):
-
Load drillhole data and display it in a 3D window.
-
Choose from one of the basic Display Options and (optionally) enable a Guideline that runs through the center of the drillhole in a fixed colour. See "Drillhole Display Types", above, for more information.
-
Drillhole segments can be Sized and scaled by either a fixed amount, or based on their associated data attributes. The attribute values can control the width of the line.
- Legend — specify a legend that contains values for line width.
- Column — select a column that contains the numeric data attribute for line width.
- If a data Column is specified for scaling, you can specify option Constraints to how variable size values are applied to the current overlay. You do this by specifying a Minimum and Maximum
value.
- Minimum — the minimum allowable width of a drillhole segment. Any base value that is less than this width is treated as '0', and is not displayed. If required, the Guideline option can be used in this case to make the drillhole visible.
- Maximum — if selected, drillholes with a greater width than the value specified in the adjacent box are displayed using the specified maximum value.
- Choose how to Color your drillhole. See Legend Controls.
-
Apply your settings to update the target 3D view.
To define additional settings for the "Points" rendering type:
The following options only appear if Display Options is set to Points.
-
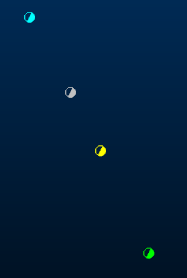
Choose between 2-dimensional symbol and a 3-dimensional sphere.
-
2D— structural symbols are shown as flat, shadeless items. Choose from a library of symbol shapes, for example:
If displaying a 2D symbol, define its Style:
-
Choose between a fixed symbol, or a symbol that corresponds to an integer in the drillhole object's database:
-
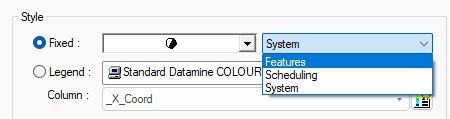
Fixed — choose a 2D symbol using the list provided. If multiple symbol sets exist on your system, choose the set using the list on the right, for example:
-
Legend — Pick a Legend and data Column containing symbol values in your drillhole database. This allows you to display multiple symbols down the same hole, if multiple data values exist for the chosen data Column. You can also access various legend-related functions using the pallet of icons on the right:
 Show the currently-selected legend
intervals and display properties.
Show the currently-selected legend
intervals and display properties. Edit the currently-selected legend
using the Legends Manager
dialog.
Edit the currently-selected legend
using the Legends Manager
dialog. Select a default legend for the selected
data column if one already exists, or if no default legend
is available, the Create
New Legend wizard will appear to let you create a new
legend.
Select a default legend for the selected
data column if one already exists, or if no default legend
is available, the Create
New Legend wizard will appear to let you create a new
legend.
-
-
-
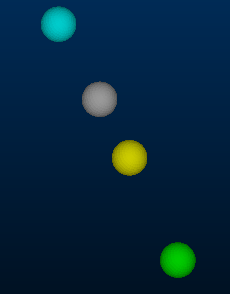
3D — display a 3D sphere instead of a flat point, for example:
-
-
Choose the Position at which your 2D or 3D symbols appear:
-
Start — display the symbol at the FROM position of the sample. For the first sample, this is the collar position.
-
Center (default) — display the symbol halfway down the length of the sample.
-
End — display the symbol at the TO position of the sample. For the final symbol, this will be the end-of-hole position.
-
-
Apply your settings to update the target 3D view.
Related topics and activities