Rotation Parameters in VARFIT and Variogram Charts
One of the features of VARFIT is that X, Y and Z values need to be manually assigned to the three orthogonal variogram model axes. If this is not done, this can potentially result in an incorrect definition of the rotation parameters in the model i.e. the default assigned values will not reflect what the rotation axes/angles should be. During Modeling Fitting, you don't need to define the axes although a notational XYZ is still used behind the scenes.
The important thing to remember here, is that although the axes and their associated rotations are potentially defined differently in VARFIT and Variogram Charting, the resultant Azimuth and Dip parameters for each of the X, Y and Z axes will be the same. When using VARFIT the user has a choice of which are X, Y and Z. When using Variogram Charting there is no choice. Therefore, it is quite likely that using VARFIT involves selecting a different X, Y and Z from the automatic assignment in variogram charting. Thus, although the model fitting process has been simplified, it does mean that a model created in VARFIT may not be consistent with VARMOD. Although the rotations and axis definitions of the models created using the two processes may differ they will both be correct and either can be used for grade estimation.
A Rotation Parameters Example
The example below shows how a single set of variogram model axes parameters are defined and displayed in VARFIT and in Variogram Charting.
The following table lists the summary variogram model axes parameters:
|
Azi / Dip |
Colour |
Range |
XYZ |
Rotation |
||||||
|
|
|
|
VARFIT |
Variogram Chart |
VARFIT |
Variogram Chart |
||||
|
1 |
2 |
3 |
1 |
2 |
3 |
|||||
|
180 / 60 |
Red |
20 |
Z |
Z |
-90 / Z |
-30 / Y |
180 / X |
0 / Z |
0 / Y |
30 / X |
|
90 / 0 |
Green |
60 |
Y |
X |
||||||
|
0 / 30 |
Blue |
120 |
X |
Y |
||||||
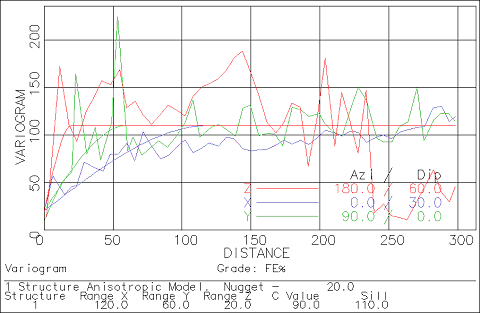
This is how the model is displayed in VARFIT:
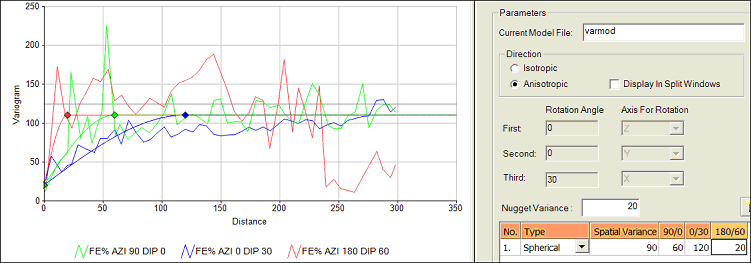
This is how the model parameters and corresponding model graphic is displayed in the Model Fitting tab and Preview pane (click to expand):
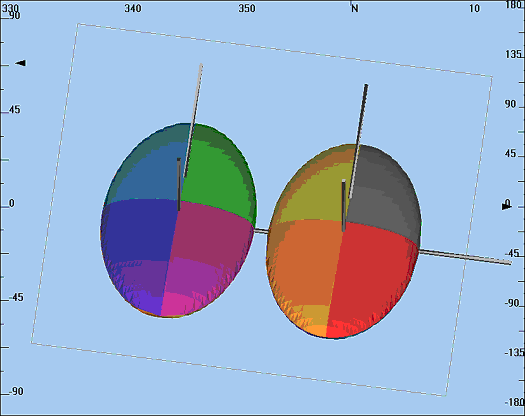
The search ellipsoid wireframes from modeling in VARFIT (left) and a Variogram Chart (right) are identical in their orientation and dimensions:
Defining a Model in a Variogram Chart
When defining an anisotropic variogram model in a Variogram Chart, the requirement to define the axes has been removed although a notational XYZ is still used behind the scenes (and displayed in the dialog).
As soon as Add a Structure has been clicked, the three range columns are assigned X, Y and Z headings, as shown below:
However, as soon as Applyis clicked, they are replaced by actual Azi / Dip values for each of the three X, Y and Z axes respectively:
Related topics and activities


