
a
|
|
Studio Products - Getting Around An overview of your Studio user interface |

Your User Interface
Previous versions of Studio have relied on multiple mechanism for delivering functionality to you, and in many cases, this flexibility has been maintained to allow you to discover the way you want to work. Yes, command-line and quick-key addicts will find the same familiar environment and responsiveness in this version.
Similarly, the powerful context-sensitive menu options available
in the past are not only retained, but extended to help you progress
through your resource/reserve modelling tasks accurately and rapidly.
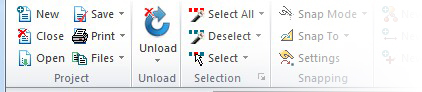
Ribbon Interface
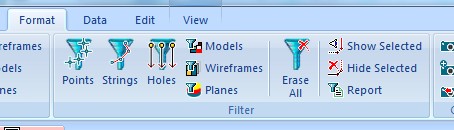
Your application adopts a ribbon system to deliver the majority of
its core functionality, moving away from the toolbar-heavy approach
used in previous versions. Context-sensitivity means that only the
commands relevant to your current Data View (see below) will be displayed
and/or enabled.
The out-of-the-box configuration has been designed to serve the vast majority of geological modelling needs, segregating functions into domain-based command groups and tabs whilst keeping commonly-used commands available at all times.
Ribbons are also available for customization to allow you to set up your user interface the most appropriate way for your role and tasks.
Context-sensitive information for every ribbon command has been provided (way in advance of the previous tooltips) to allow you to research your command choice before you activate it. This information isn't provided instead of detailed online Help, it is provided in addition to comprehensive digital documentation.
Data Views
As in previous versions of Studio, dedicated (linked) data windows are provided to deliver the most appropriate context for the type of work being performed. By default, the following data views are displayed:
-
Start Window
The landing page. The Start window is displayed on initial startup and is available throughout your project session. It can be used to view the latest online/offline information relating to your product, access recently-opened projects, create a new project or browse for a project. -
3D Windows
3D windows offer a combined visualization and engineering interface to complete your CAD-style engineering tasks in a flexible environment. Many interactive commands are available to make the geological modelling process intuitive and rich in 3D visual feedback. A 3D window also allows you to spawn independent, floating versions of the 3D view.
Find out more about 3D windows...
Find out more about external 3D windows... -
Task Window
Similar to the 3D window, and including many of the same general formatting and visualization functions, the Task window is a dedicated data view that is used to display managed open pit project data, such as that generated during pit design or reserves generation, for example.
Find out more about the Task window... -
Plots Window
Report-ready plots, logs, charts and other supporting data can be constructed from your 3D data quickly and easily with the Plots window. Working with the same data displayed in other data windows (including 3D), and with a powerful template function, you can create detailed and unequivocal standard reports in minutes.
Find out more about the Plots window... -
Summit Window
This is your gateway to Datamine cloud data management and processing portal. Once setup (contact your Datamine representative for more information) you can seamlessly transfer data between your local/LAN-based project data and the Summit cloud platform. From there, you can share your information visually with any other Summit user, just by sending them a URL. It will even prepare an email for you!
Other data windows are displayed either on request, or automatically as a result of creating a particular type of data:
-
Logs Window
Strip log display and configuration, again based on the same underlying data as shown in other data views. This window is automatically displayed when a new Log Sheet is created, and will be automatically displayed if a project containing log data is loaded.
Find out more about the Logs window -
Tables Window
Context-sensitive data table formatting options can be found in the Tables window, allowing you to create a formatted view of your data objects using a wide range of display options.
Find out more about the Tables window... -
Design Window
A more traditional CAD-style design interface that is included with Studio RM for legacy support. Many ribbon commands are also available to users of the Design window.
Find out more about the Design window... -
Graphics Window
Included for legacy support of older Studio processes - this will be displayed automatically if required by the running process. -
Screen Window
Included for legacy support of older Studio processes - this will be displayed automatically if required by the running process.
Control Bars
Control bars are a great way to access data-specific functions and processes. Anyone familiar with Studio 3 will feel at home here, but for users not familiar with this facility, a wealth of information is available here to help you make the most of these powerful tools:
Getting More Help
Your application is designed to be intuitive. In addition to supporting you through one of our many international offices, you can find a wealth of information about your system using the following methods:
-
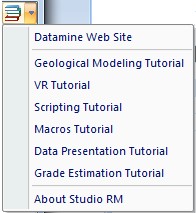
Online Help: clearly, you know how to access this already! However - you can find out more about getting the best out of your Help system here, and can access a range of help topics and tutorials using the 'Pile of Books' icon at the top right corner of the screen:
-
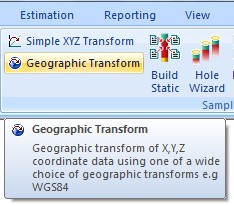
Context-sensitive Tooltips: much more than the tooltips of old, all ribbon commands are introduced by a short overview of the command and pointers on how to use it, e.g.:
-
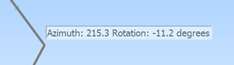
Cursor Tooltips: your application builds on the feedback system of previous versions to promote your awareness of important information throughout your project session. One of the main advances in this respect is the new Cursor Tooltips that can be enabled to provide status information on-screen at the appropriate place, e.g. close to the active cursor. This resolves the issue faced by many traditional software applications whereby status information could be missed as it does not appear in the area of focus:
|
|
Related Topics |
|
|
Customizing
Your Interface
Ribbon Reference Selection Control Bars Overview Data Control Bars Overview Output Control Bars Overview Configuring tabs |
Copyright © Datamine Corporate Limited
MIN 20044_00_EN