
Drillholes Properties: Labels
To access this screen:
-
On the Drillholes Properties screen, select the Labels tab.
Note: A Datamine eLearning course is available that covers functions described in this topic. Contact your local Datamine office for more details.
Use the Drillhole Properties: Labels screen to control the formatting of drillhole annotation relating to the target overlay.
A 'label' is represented by one or more text items. These can be freeform text, calculated values or values of point object attributes, or any combination. Labels are first defined by setting up the Text field with one or more text items (over one or multiple lines) and then defining that particular label's visual formatting.
You can define as many labels as you need, with each label supported by its own formatting settings. This means you could have, say, a large green label indicating the XYZ position of one aspect of your data on the left and a smaller label on the right of your data indicating another attribute value, for example:
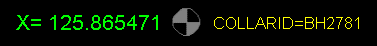
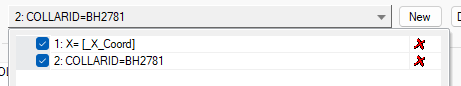
In the above image, 2 separate labels have been defined for the same object overlay. You can quickly view all labels assigned to a particular overlay using the Label drop-down menu. This lists all labels in a table, letting you enable or disable particular labels as you need to, and even delete unwanted labels, for example:
You can add labels to the list (and format them independently afterwards) by clicking New.
To add and format labels for 3D overlays:
-
Check Display labels if it is unchecked.
-
Expand the Label list to see all previously defined labels. If none have yet been set up, a default label is added that shows the BHID value for the drillhole overlay.
Tip: each label can be independently checked or unchecked in this list. Unchecked items are not displayed. This can be a useful way to enable or disable labels temporarily without deleting and recreating them.
-
Click New to create a new label with a unique numeric suffix. The Label description is read-only, but updates as label parameters are specified.
-
Click Delete to remove the currently displayed Label. This cannot be undone.
-
-
Configure your label Text. This is what appears in the 3D window(s).
You can do this in the following ways:
-
Text entered in square brackets indicates that an attribute value should be displayed. For example, "[BHID]" indicates that the value of the BHID attribute is required.
Tip: check and pick an attribute from the Column list and click Insert to enter it at the current cursor position.
-
Adding ":.n" after an attribute (all in square brackets) constrains numeric attribute values to ndecimal places. For example, "[LENGTH:.2]" shows the LENGTH value to 2 decimal places.
Tip:check and pick an attribute from the Column list and choose anything other than Auto in the DP list to Insert an attribute and decimal point constraint automatically.
-
Text entered without square brackets is represented literally. Whatever you type appears in each label at the position shown.
-
Check Depth and click Insert to specify that a depth indicator is required. Alternatively, enter "<Depth>" manually (or "<Depth:.3>" where the .3 is a decimal places indicator.
Note: a label can be comprised of one or more elements, and you can mix and match Column, Depth and freeform text elements. For example "Borehole ID: [BHID] at <Level:.2> meters" could be displayed as "Borehole ID VB276 at 220.45 meters".
-
-
Configure your label Font:
-
Choose your font type:
-
A 2D font is always displayed 'face on' to the screen and at a constant screen size. If selected, the Plane orientation setting (see below) can't be used.
-
A 3D font size varies depending on the viewing distance (if the viewing distance is too far, the label disappears). If 3D is selected, you can choose which 3D plane is used to orient your labels (see below).
-
-
Font—specify the font style using the accompanying list.
-
Size—specify the size of font using the spin buttons.
-
Alignment—justify multiple rows of text to the left, right or centre.
-
- Choose the Position of your label (in relation to the data it represents). The options here vary on the type of data you are formatting:
Data type Option Description Points Points This is the only option for points. Add a symbol at each point location. Planes Planes This is the only option for planes. Add a symbol at the centre point of each plane. Ellipsoids Ellipsoid Centers This is the only option for ellipsoids. Add a symbol at the centroid of each ellipsoid. Block Models Blocks This is the only option for block models. Add a symbol at the centroid of each cuboid.
Warning: Be careful with this setting. Models can contain a large number of cells and label display can slow down your system.
Wireframes Triangles This is the only option for block models. Add a symbol at the centre of each triangle. Drillholes Collars Add a label at the top of each drillhole. If displaying a depth label, the current FROM value is displayed. Drillholes End of hole Add a label at the bottom of each drillhole. If displaying a depth label, the current TO value is displayed. Drillholes Segments Add a label for each drillhole segment.
Note: If displaying a Depth label, the depth half way between the FROM and TO value for the segment displays.
Strings Every Show symbols at the vertex (Point) position or the mid point position on each string Edge. Strings % along If you want to position symbols on a string edge, but need more control over precisely where, choose this option and at which part of the edge you want them to appear. Strings, Drillholes Intervals If the spacing of symbols is important, set the distance between symbols along the data. This could be useful, for example, to create a type of tape measure in 3D, or to show depth markers for a drillhole. All Group by Labels are displayed by any groups of data that have the same value for the column selected in the accompanying list. Labels are positioned at the center of the groups, calculated as the average position of the relevant points. -
Choose your label Offset.
Set the position of the label relative to the data. By default, the label is centred on the drillhole. The data is represented by the central black box in the grid.
-
Define the Orientation of your label.
2D and 3D labels can be set as Screen, Parallel or (in the case of strings and drillholes) Perpendicular orientation. For 3D labels, their orientation can also be set as Plane. The rotation of both 2D and 3D labels, and the requirement to keep them upright can also be specified, under the conditions described below.
-
Screen— labels are shown in the plane of the screen, according to the rotation angle. This option is available for both 2D and 3D labels.
-
(String and drillhole overlays) Parallel— labels are orientated in the direction of the data.
-
(String and drillhole overlays) Perpendicular—labels are orientated at right angles to the data.
-
Plane— only available if 3D is selected in the Font group. Labels are orientated in the specified plane.
Note: when the Plane option is selected, labels may appear back-to-front and/or upside-down, depending on the viewing angle.
-
Azimuth and Dip—if selected, then you can define the azimuth of the labels within a range of -360 to 360 degrees, and the dip within a range of -90 to 90 degrees.
-
Section—if selected, labels are aligned to the section that you select in the accompanying list. You can either select the active section, or any currently-loaded section.
-
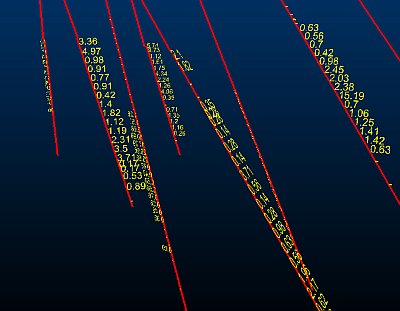
(String and drillhole overlays) Best fit – labels are orientated in the best-fit plane of each individual drillhole, as shown below.
-
(Plane overlays) Plane – Orient the text to align with the plane of the data.
-
-
-
Choose if the font should have Rotation. Labels are rotated about their centre, within a range of -360 to 360 degrees. How this rotation is applied depends on whether the Font is 2D or 3D (see above).
The Rotation option is available in the following conditions:
-
2D labels—Screen is selected in the Orientation group.
-
3D labels—Screen or Plane is selected in the Orientation group.
-
-
Check Keep upright to ensure your label remains. This setting only applies to the Parallel and Perpendicular orientation settings, where it is possible to invert your label when the data view is inverted around one axis.
-
Choose your label Color settings. See Legend Controls.
-
Choose your fine-tuning Options:
-
Always on top—set this option to prevent labels being obscured by the displayed data. This is particularly useful when labelling 3D data which may make it difficult to see labels due to their shape.
-
Group thousands—if labels contain long numbers, selecting this option makes them more readable by separating each group of three digits with a comma.
-
Hide absent values:
-
If checked, absent data values are not labelled.
-
If unchecked, absent data values are labelled as "-" in the 3D window.
-
-
Related topics and activities
-
Related Information and Activities
- Format Landmark Symbols
- Format Structural Symbols
- Drillhole Properties - General
- Drillhole Properties - Lines
- Drillholes Properties: Symbols
- Drillhole Properties - Columns
- Drillhole Properties - Associated Files
- Drillhole Properties - Info Mode List
- Drillhole Properties - Templates
- Legend Controls