|
|
Format Display - Grids - More Line Formatting |
Grids - More Line Formatting
To access this dialog:
-
In the Format Display dialog select the Grids tab and then the More Line Formatting sub-tab.
-
In theSheetscontrol bar,DesignorPlots Overlayfolder, right-click a grid overlay and selectGrid Properties; select theMore Line Formattingtab.
The Interactive Grid can be fine-tuned using the settings on this tab, allowing you to precisely control the graphical format of your grid for the Design or Plots window - for 3D grids in the 3D
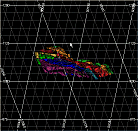
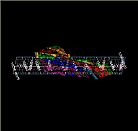
Note that some options described here are available only for specific Grid types, for example, you can only set the properties for a particular spatial axis if that axis is enabled on Options tab. Similarly, if you are setting up a grid that is aligned to the [View Plane] you will not be able to access the Filled check box on this panel, as filling this type of grid would serve no visual benefit - this restriction, however, is applicable to the [Section Plane] grid as this particular plane is potentially non-orthogonal:
|
|
|
|
View Plane Grid Example |
Section Plane Grid Example |
When you have made the necessary settings to whichever fields are available, click Apply to update the Design or Plots window with the new settings.
Field Details:
The following fields apply to the X, Y, Z and Border grid lines:
Line Color: set the line color for the selected grid component using the color picker tool supplied.
Major line style: select from a graphical line style to use when drawing major grid lines.
Major line weight: set the weight (thickness) of the major lines, in pixels.
Major line intensity %: set the opacity of the major grid lines here, using a value from 0 (invisible) to 100 (totally opaque).
Minor line style: set the weight (thickness) of the minor lines, in pixels.
Minor line weight: set the weight (thickness) of the minor lines, in pixels.
Minor line intensity %: set the opacity of the minor grid lines here, using a value from 0 (invisible) to 100 (totally opaque).
Filled %: if the grid being defined is delivered via a non-orthogonal plane, you can elect to fill the grid with a 3D color (taken from the Border Line Color). Once active, you can set a value between 0 and 100 to dictate the transparency of the grid's surfaces. Note that grid planes will always be drawn 'behind' the data it relates to, without obscuring its view.
| |
Related Topics |
|
|


