Section Line
To insert a section line overlay into a 2D projection:
-
In the Sheets or Project Data control bar, right-click a projection's overlays folder and click Insert. Pick Section Line and click OK.
A section line is a way of indicating the position of the currently active section in a projection. See Sections and Projections.
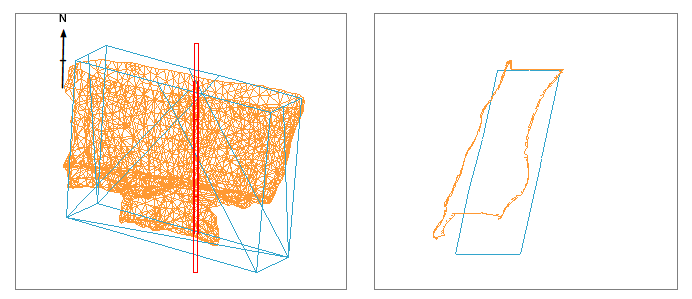
A section can be used to orient the view of a projection, but can also be viewed from any angle to indicate the position of, say, a cross section of data displayed in another projection, like this example, showing the cross section of a surveyed and design stope wireframe for the purposes of reconciliation:
The section line (shown in red) is a standalone plot item, and has its own properties, independent of the data it transects and (if one is displayed) a 3D section. The section line always aligns with the currently active section.
Whilst the base section properties (orientation, clipping and so on can be managed using the Section ribbon and the Projection Properties screen, a section line is a standalone plot item. It is actually the legacy representation of a section in a projection (the newer 3D projection overlays can display a 3D section plane using the same technology as the 3D window).
Section Line Properties
The following properties appear on the Section Line screen and in the Properties control bar if a section line is selected:
| General | |
| Name | This is always "Section Line" |
| Share |
Choose if the section line should be available in other projections:
|
| Appearance | |
| Show all sections | Only relevant if a section definition table is loaded, in which case, Yes means a section line is drawn for all sections in the table. No means only the active section line is drawn. |
| Colour | Pick a section line colour. |
| Line Style | Choose the style of line. |
| Hide | Toggle the visibility of the section line. You can also do this using the Sheets or Project data control bar. |
| Only display in 3D views | If Yes, a section line is only drawn if the view is not aligned to the section (meaning a "3D projection"). If No, the section line is drawn in all projections where the view direction permits it. |
| Limits | |
| Fit to data | If Yes, the section cuboid wraps around the outer hull of all displayed data. If No, the remaining settings on the screen determine the display format. |
| X From/To | Set the minimum and maximum extents in X for the section line cuboid. |
| Y From/To | As above, but for the Y axis range. |
| Z From/To | As above, but for the Z axis range. |
| Mid Point | |
|
X/Y/Z Mid |
Choose the mid point in world coordinates for the section's mid point. By default, this equates to the mid point of displayed data. |
| Span | |
| X/Y/Z Span | Adjust the dimensions of the section line cuboid. This adjusts the corresponding From and To locations equally to fit the new size. |
Related topics and activities


