
STATCOM Process
To access this process:
- View the Find Command screen, select STATCOM and click Run.
- Enter "STATCOM" into the Command Line and press <ENTER>.
See this process in the Command Table.
Process Overview
Note: This is a superprocess and running it may have an effect on other Datamine files in the project.
Compute comparison summary statistics for validating a model versus samples.
Optionally, output data to Excel to display a summary graph representing a comparison of model and sample statistics by domain.
A samples file and a corresponding model file must exist. Both must contain a numeric value for analysis. Typically, this would be a grade value, although any numeric value can be used. The attribute does not have to be of the same name between the two files, and either or both can contain absent or empty values.
Optionally, you can specify a domain field to segregate results per domain. If Excel output is selected (@EXCEL=1 or 2), comparison results between sample and model data for each domain will be reported and displayed. The designated *DOMAIN field should exist in both sample and model files if one is selected. It is not necessary for all domain keyfield values to exist in both sample and model files; they can exist solely in one file or the other, or one can contain a subset of the partner file values.
A decluster weighting field (*DCWEIGHT) can be specified. This attribute will be in the input samples file. It is used to weight sample values for comparison with model values per domain.
A density field (*DENSITY) can be specified to select the density values in the model. The grade statistics for the model will then weighted by the cell volume*density ie by tonnage. If a density field is not selected then the model grade statistics will be volume weighted.
The density field is also used in the calculation of the total tonnage for each domain. This statistic is reported in the output tables.
A density parameter (@DENSITY) is also available. If a density
field has been selected but some of the values in the model are absent
data then they will be replaced by the density parameter value. If
a density field has not been selected then the density parameter will
be used in the calculation of the total tonnage for each domain.
Excel Output (@EXCEL=1 or 2)
Note: Microsoft Excel 2010 or later is required on the local PC in order to view output from this command.
Excel output is controlled by the @EXCEL parameter, which is enabled (=1) by default. If set to 0, only &OUT is produced.
With @EXCEL=1, the default "STATCOM.xlsm" workbook name is used. With @EXCEL=2, Excel output is generated with the workbook name based on &OUT.
If enabled, two additional CSV format files are created in the project directory:
- statcom_parameters.csv: a file that is used by the Excel macro to provide summary information.
- statcom_table.csv: a comma-delimited version of &OUT. This is used for chart calculation
Excel will be launched. Security settings for Excel must be such that Excel macros can be launched. You may need to "Enable content" when Excel launches. If macros and automation are prohibited by your Excel Trust Center settings, you will not be able to view automated chart and summary data.
@EXCEL=1 versus @EXCEL=2
The @EXCEL parameter accepts valid values 0, 1 and 2. A value of 0 is used to prohibit Excel workbook generation, while 1 outputs a workbook using the default "STATCOM.xlsm" name.
@EXCEL=2 generates Excel output as above, but ensures that the output workbook is named after &OUT. For example, if &OUT is "MyStats", the output Excel workbook is "MyStats.xlsm".
@EXCEL=1 Example
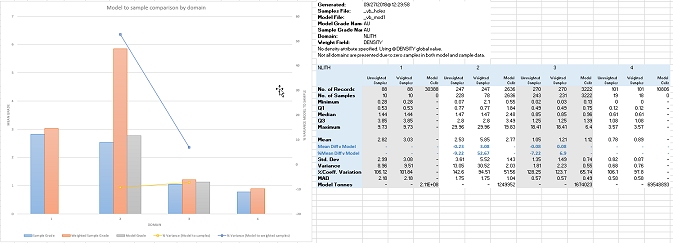
The selected samples file contains 5 lithology attributes, indicated by a numeric value in the NLITH column ranging from 0-4 inclusive. The corresponding model also contains an NLITH column, but only contains records relating to 2 of those domains. Both sample and model files contain absent grade data at various positions in their respective tables.
A weighted field (*DCWEIGHT) in the samples file, so has been specified. Absent values also exist for the weighting field, so only samples with a non-absent weighting value will be calculated.
In this example, NLITH=0 has already been coded using the assign-lithology command. It represents records where grade data is absent. This value does not occur in the model file.
The resulting Excel sheet includes a table on the "STATCOM_1" worksheet that shows the 5 lithology attribute as data rows.
The chart shows 4 clustered bars, not 5:
-
NLITH=0 is not displayed on the chart as the number of non-absent records in the sample file (SNSAMPS) and the model file (MNSAMPS) are both zero. As such, no output can be calculated.
-
NLITH=1 and NLITH=4 (far right and left clusters) show only two bars representing the sample mean grade (SMEAN) and the sample weighted mean grade (WMEAN). No Model mean grade (MMEAN) is shown because the model file contains no non-absent grade records for either domain.
-
NLITH=2 and NLITH=3 show the full set of 3 bars; both sample and model grade data for these domains exists, along with weighting information, so summary statistics have been calculated and can be compared.
Where sample, weighted sample and model mean grade data exists, two additional chart layers are applied, as line graphs;
- The % Variance between model and samples
- The % Variance between model and weighted samples
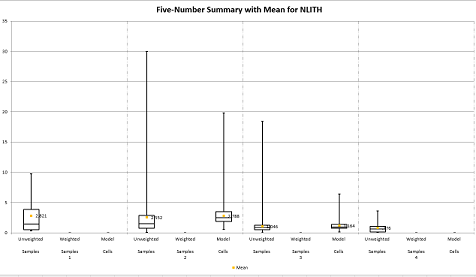
Box and Whisker Plots
The output workbook also includes a "Box & Whisker" worksheet. This includes, for each domain (or across the global data set if domain control is not exercised), a five-number summary for unweighted samples, weighted samples and model cells, for example:
Input Files
|
Name |
Description |
I/O Status |
Required |
Type |
|
SAMPLES |
Input sample file. |
Input |
Yes |
Samples file |
|
MODEL |
Input model file. |
Input |
Yes |
Block model |
Output Files
|
Name |
I/O Status |
Required |
Type |
Description |
|
OUT |
Output |
No |
Table |
Output file. This will contain the fields:
|
Fields
|
Name |
Description |
Source |
Required |
Type |
Default |
|
MGRADE |
Model field for statistics. |
MODEL |
Yes |
Alphanumeric |
Undefined |
|
SGRADE |
Sample field for statistics. |
SAMPLES |
Yes |
Alphanumeric |
Undefined |
|
DOMAIN |
Domain keyfield for statistics. Typically this would define an estimation domain. |
MODEL and SAMPLES |
No |
Alphanumeric |
Undefined |
|
DCWEIGHT |
Weighting field. Field used for weighting the samples. Typically this would be a declustered weight field derived from the GRIDDC or DECLUST processes |
SAMPLES |
No |
Alphanumeric |
Undefined |
|
DENSITY |
Density field to enable calculation of tonnage weighted grade statistics for the model. If not selected a global density will be defined by the @DENSITY parameter. |
MODEL |
No |
Alphanumeric |
Undefined |
Parameters
|
Name |
Description |
Required |
Default |
Range |
Values |
|
Excel |
Set to 1 to automatically load the domain statistics data file into Excel and display a graph of the sample to model variances and mean grade comparisons using the default "STATCOM.xlsm" workbook name. Set to 2 to also generate Excel output as above, but ensure the output workbook name is named after &OUT. |
IN |
No |
Numeric |
Undefined |
Example
!STATCOM  &SAMPLES(_vb_holes),&MODEL(_vb_mod1),
          &OUT(OUT3),*MGRADE(AU),*SGRADE(AU),*DOMAIN(NLITH),*DCWEIGHT(DENSITY),
          @EXCEL=1.0
!END
Related topics and activities