
VCONTOUR Process
To access this process:
- Enter "VCONTOUR" into the Command Line and press <ENTER>.
-
Display the Find Command screen, locate VCONTOUR and click Run.
See this process in the Command Table.
Process Overview
Note: This is a superprocess and running it may have an effect on other Datamine files in the project.
The VCONTOUR process creates a variogram contour plot and displays it in the 3D window. This can be used to determine the major and minor axes of anisotropy in the defined plane.
The process is divided into two parts:
-
Select Variogram - used to define and checks the data file and parameters; perform initial transformation of the data.
-
Create Contours - creates contours using the defined parameters. The contouring process uses the inverse power of distance method to interpolate onto a regular grid, defined by the Grid Interval value, and uses a search radius defined by the Search Radius value. Changing the values of these two parameters can change the shape of the contours so it is often worth experimenting with different values of these parameters.
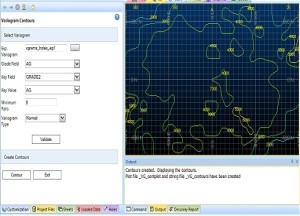
Select Variogram
Experimental Variogram File
The input to the VCONTOUR process is an experimental variogram file, as created by VGRAM. VCONTOUR will always contour in the local horizontal plane as defined by the VGRAM parameters ANGLE1, AXIS1, ANGLE2, AXIS2, ANGLE3, AXIS3. These parameters are stored as implicit fields in the data definition of the experimental variogram file created by VGRAM. If the 3 angles are all zero (the default) then the plane is the horizontal plane; otherwise any rotated and dipping plane can be defined.
Variograms must have been created for a minimum of 2 azimuths.
Grade Field
Select the required grade field from the drop-down.
Key Field and Key Value
If a Key Field (eg rock type) were specified when running VGRAM then this value will appear in the Key Field drop down list. You must then select the required Key Value.
Minimum Pairs
It is often useful to be able to specify the minimum number of sample pairs to be used in the contouring. If the actual number is less than the minimum then the variogram value will not be used for contouring.
Variogram Type
Select the required variogram type from the drop-down.
Create Contours
Contour Interval
A default Contour Interval is provided. This may not be appropriate in every case so you can change the value. The maximum contour value is usually a little larger than the variance of the original samples (the sill of the variogram), so dividing this value by say 20 would give a Contour Interval of an appropriate magnitude.
Number of Decimal Places
The contours are annotated with their values. You can specify the number of Decimal Places for this annotation.
Grid Interval
You can specify the Grid Interval to be used by the contouring algorithm. A value between one and five times the variogram lag distance is often appropriate.
Search Radius
You can specify the Search Radius to be used by the contouring algorithm for interpolating onto the grid points. A value a little larger than the Grid Interval is often appropriate.
Annotation
If you tick the Annotation check box, then all the variogram values is displayed on the plot.
Input Files
|
Name |
Description |
I/O Status |
Required |
Type |
|
IN |
File to be validated. |
Input |
Yes |
Table |
Output Files
|
Name |
I/O Status |
Required |
Type |
Description |
|
OUT |
Output |
Yes |
Table |
File containing validated records. |