|
|
Plot View Configuration Positioning and Scaling Plot Overlays |
Position and scale plot overlays
|
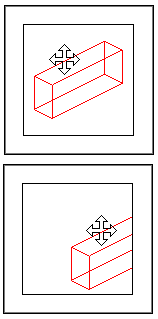
The overlays inside the data area can be positioned and scaled independently of the section definition and any plot items on the page. Use theViewribbon'sPancommands to pan the data
Use View| Scale to change the plotting scale of data inside the data area:
|
|
|
|
Changing the scale only affects drillhole data and 3D objects and will not change the size of plot items like text boxes. |
Smart features
When you change the position and scale of the overlays, the program will automatically update any plot items which are related to the data view including:
-
Co-ordinate grid lines and labels
-
Scale bar
-
Scale fields in title blocks
- Surface profiles in profile boxes
|
|
Related Topics |
|
|
Change
plot area size and position Rotate view direction |


