Seismic Data Legends
Seismic data is displayed using a "Hybrid Block model" format (a format whereby a single Datamine 'header file' is used to reference other data files in a particular format such as .DAT which contain the seismic data points in binary format).
To improve performance and provide interpolated colours when viewing seismic data, a feature has been added to your application where special preset ‘fast legends’ are available within the legends list.
These legends are applied in a slightly different way to standard legends, and are particularly applicable to very large data sets. The trade-off (there's always a catch) is that the distribution of intervals throughout the legends are automatically spread over the full range of values within a field.

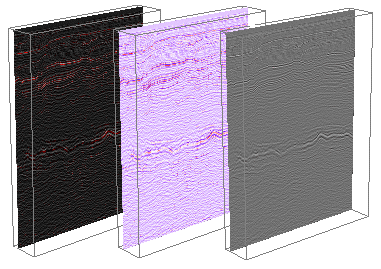
Examples of seismic data display in a 3D window
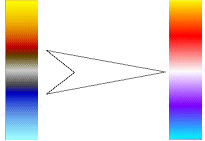
However, with fast legends, variation of the saturation point around the centre is varied to provide control over apparent visual contrast. Instead of colour ranges spanning data values from 0 to 255, as they do for standard legends, they will be adjusted to start and finish within the data range: e.g. only spanning from 55 to 200. This increases the density of the colour distribution around the neutral centre point thereby amplifying the appearance of any lower magnitude features.

These are currently 7 hard-coded colour ranges available, intended to mimic standard seismic legends in use throughout the industry.
-
Black -> White
-
Red -> White -> Blue
-
Red -> White -> Black
-
Brown -> White -> Blue
-
Rainbow Red -> Purple
-
White -> Black -> Yellow
-
Cyan -> White -> Yellow
Due to the way these 'low impact' legends are applied, further control has been added to allow these ranges to be dynamically altered in order to maximize the visual contrast for the data being viewed. This is achieved by a Contrast slider tool on the Section Control tool.
Related topics and activities

