|
|
The Crosstab Control Bar Viewing DTS Crosstab Data in Studio OP |
The Crosstab Control bar
The Crosstab control bar displays DTS information from the last time your application was synchronized with DTS. Summary values are displayed for a specific date range - for example, average grade value, fuel cost, etc. Although visible by default, the Crosstab control bar can be enabled or disabled using the toggle in the drop-down menu system at the following location: Home ribbon - Window | Show | Crosstab Bar
Presuming crosstab information has been set up in the connected DTS project (consult your DTS help for information on how to do this), during playback of an animation (using the Sequence Control toolbar), the data columns will update to show a consolidated or compound value for the given data range/phase in the animation. Before playback, each crosstab row will be shown in the bar and the following 5 data columns represent the next stage of animation, e.g. according to the M4DANI field:
As the animation progresses, the data columns update to show the relevant details for each animation phase. In this example, for the average grade values for Silver and Gold:
|
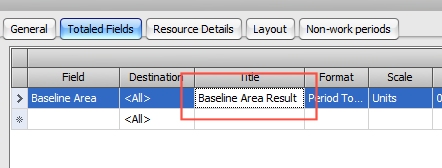
The CrosstabTitle field will
report the Title,
not the Name of the
field that is defined in the DTS Crosstab Options panel, for example: |
If you make changes to your DTS project (in terms of crosstab information), you will need to click Refresh to ensure those changes are synchronized with your 3D window view.
|
|
Related Topics |
|
|
DTS
Connections - Introduction DTS Connections - Synchronization Setup DTS Connections - Animation DTS Connections - Filtering Schedule Data DTS Connections - Crosstab DTS Connections - Dependencies |


