|
|
Command Help |

|
Command Name |
Menu |
Quick Key |
Link to Command Table |
|
query-lines |
Home ribbon | Query | Report | Line |
ql |
Description
Calculate statistics for a line interactively defined by two end points.
How to use
-
Run the command.
-
Select (left or right-click) the line's first point.
-
Select (left or right-click) the lines second point.
-
Check the position of the grey query line and the associated statistics in the Output control bar.
")
The displayed statistics include:
-
X, Y and Z coordinates of each of the end-points
-
X, Y and Z Difference between the second and first points
-
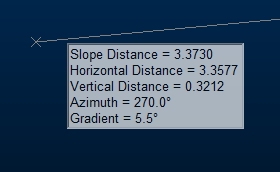
Slope Distance, Horizontal Distance and/or Vertical Distance between the two points
-
Azimuth (direction) of the line in degrees
-
Gradient of the line in degrees, 1:X and %.
-
-
Repeat steps 2 to 4 for additional queries.
-
Click Cancel.
|
|
As an example: Querying the line, snapped to
the two strings shown below (ore body section strings and
drillhole data) : Displays the following statistics
in the Output control bar: If cursor tooltips are enabled, summary information is displayed on screen at the cursor location, after the first point has been digitized:
You can click and hold/drag the second point to dynamically update cursor tooltip information as the cursor moves. Note that:
|