Variograms
This Variogram Display and Modeling functionality has the following features:
-
Uses the Datamine Charting framework which is shared by the Histograms, Scatter Plots and Stereonet options.
-
Report-quality graphics that can be saved as standard image files (.jpeg, .gif, etc) or as plot items in the Plots window.
-
Ability to save one or more 'variogram display and modeling scenarios', each as a single case with all its parameters.
Note: A case is set up by creating a new variogram chart sheet, represented by a single tab in the Plots Window.
-
The simultaneous opening of multiple cases, together with Histogram, Scatterplot and Stereonet charts.
-
Selection of multiple experimental variograms from one or more files created by the variogram calculation process (VGRAM).
-
Selection and display of experimental variograms using up to three key fields.
-
Interactive model fitting by dragging control points with the mouse or by typing parameters into dialogs.
-
Fitting of anisotropic models in a single window, or in three individual windows with full linking of common parameters.
-
Choice of model type for up to five structures.
-
Detailed formatting options to specify axes, annotation, titles, line styles, colors, etc.
-
Display of variogram rotation angles in either the world coordinate system, or relative to a rotated plane.
-
Choice of display of variogram, relative variogram, log variogram or covariance. Any of which can be normalized.
-
Creation of a wireframe ellipsoid from the variogram model, to aid in visualizing variogram ranges and axis rotation angles.

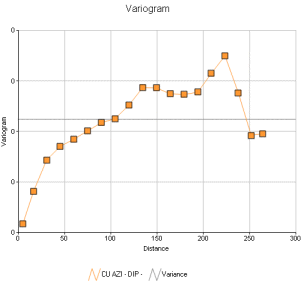
An example of a variogram chart
Note: Experimental variogram data is generated by the VGRAM process, and also as part of advanced estimation functions in Studio RM.
The Variogram Screen
To display this screen:
-
.
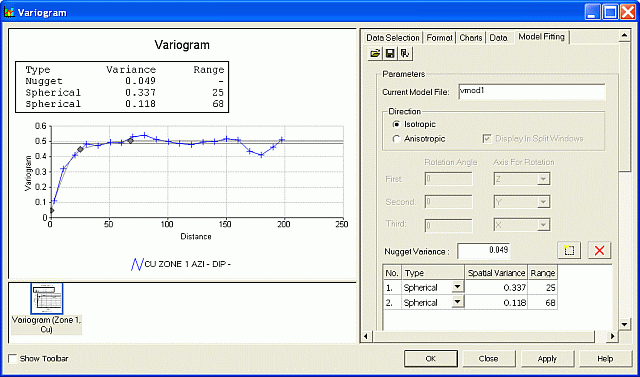
The Variogram screen controls aspects of histogram display, formatting and modeling. The screen consists of two main areas: a preview area on the left and a controls area on the right.
The Preview Area
The preview area is used for:
-
Previewing the current settings for the displayed variogram(s).
-
Interactive model fitting.
-
Interactive positioning of the following chart components:
-
Chart title box.
-
Variogram model parameters box.
-
Legend box.
-
The Controls Area
The control area, on the right is, divided into the following tabs:
-
Data Selection: load and display experimental variograms from one or more files.
-
Format: configure the variogram chart's Annotation, Axes, Grid, Comments, Colour, Legend and Options parameters.
See Variograms: Format.
-
Charts: control the display of loaded variograms using the folder tree.
-
Data: view the lag details for the selected variogram.
See Variograms: Data
-
Model Fitting: fit a model to the current variogram chart.
Create a Variogram Chart Sheet
To create a new variogram chart sheet, for displaying and modelling:
-
Display the Variogram screen.
-
As a minimum, in the Data Selection tab, load an experimental variogram file(s), and define the associated parameters and click Apply.
Note: You'll need an experimental variogram file for this, typically created using VGRAM or as part of advanced estimation.
-
If a variogram model is to be created, in the Model Fitting tab, specify a model file and define a set of model parameters.
Related topics and activities


