Kriging Neighbourhood Analysis
Kriging Neighbourhood Analysis (KNA) is a process for optimising estimation parameters, including block size, number of informing samples, search range and the number of discretisation points. Parameters are evaluated based on two conditional bias statistics:
- Kriging Efficiency (KE), which measures the effectiveness of the kriging estimate to reproduce the local block grade accurately. A low kriging efficiency indicates a high degree of over smoothing. Conversely, a high kriging efficiency indicates a low degree of over smoothing.
- Slope of regression (or conditional bias slope), which summarises the degree of over smoothing of high and low grades. A slope close to 1 indicates that the regression between the estimated and the actual grades is likely to be very good, meaning there is limited over smoothing. Conversely, low slope values indicate that there is over smoothing and hence a poor relationship between the estimated and the actual block grades.
A KNA is performed by calculating the KE and Slope of regression for varying combinations of estimation parameters. The resulting graph is then used to help in selecting which parameters result in the least over smoothing. In Supervisor, a KNA component may be added to any Continuity Models component. By default, the KNA uses the search ellipse defined by the Continuity Models. The Params tab can be used to view and edit the block centroid, search angle and range, samples count and discretisation parameters. The Blocks tab is used to define the different block sizes to evaluate, as well as to begin the KNA refinement. The KNA graph displays both the Kriging Efficiency (KE) as a percentage on the left-hand Y-axis, and the Slope of regression as a value no greater than 1 on the right-hand Y-axis.
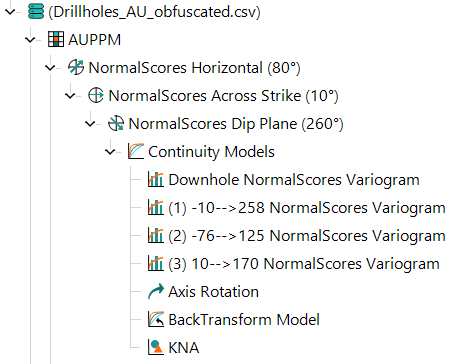
KNA components can be inserted under any Continuity Model component in the Project Tree. See Insert a Component. The image below shows an example of a KNA component in the Project Tree.