Data Grouping Methods
Supervisor has four methods for grouping data in the Project Tree.
Assay/Domain Grouping
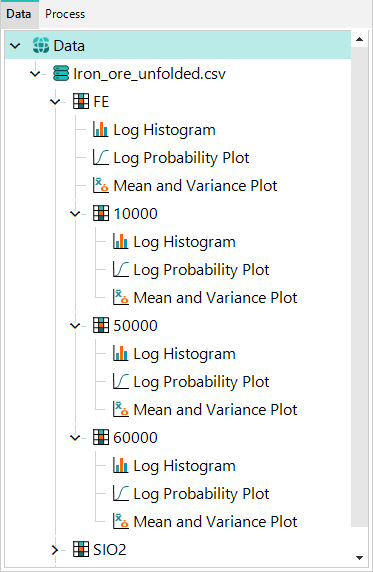
When the data is grouped as assay over domain, the assay types each have all of the domains loaded as child components. Each assay and domain has its own set of child analysis components, which are the Histogram, Probability Plot and Mean And Variance Plot by default.
The direct child analysis components of the assays use all data from that assay type (a combination of all of the data split between the domains), whereas the direct child analysis components of the domains each have the data from the assay type above them (the domain's parent) that occurs in that domain.

Domain/Assay Grouping
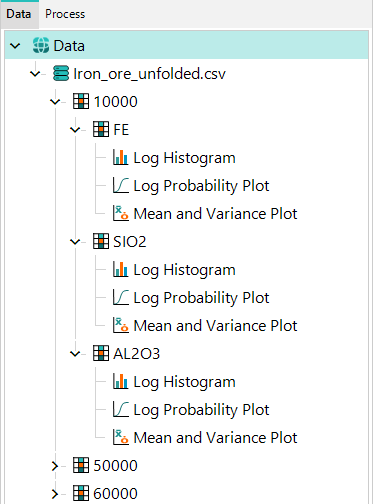
When the data is grouped as domain over assay, the domains each have all of the assays loaded as child components. Each assay has its own set of child analysis components using the data from that assay type and domain. However, the domains only have the assays as child components, because different types of assay data cannot be mixed to produce plots directly under a domain.

Assay Grouping
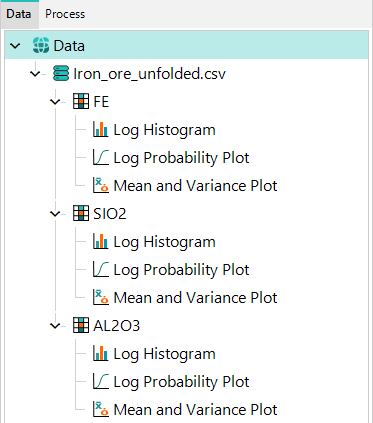
When the data is grouped by assay, all of the assays are loaded without any domains, so each assay contains all of the possible data available for that assay type. Each assay has a set of child analysis components.

Domain Grouping
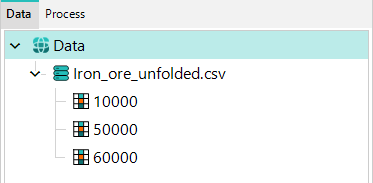
When the data is grouped by domain, all of the domains are loaded without any assays. In this situation, only analysis components that compare multiple assays, such as scatter plots and Q–Q plots, can be added.


