Drilled Hole Data Analysis
This video, recorded using an earlier version of DataBlast Pro, provides an introduction to the reports to analyse drilled hole data.
Drilled Depth Accuracy Reports
Use a drilled depth accuracy report to display which holes have been drilled longer or shorter than designed. You can specify a tolerance between 0 and 20 percent, or 0 and 3 metres, or 0 and 6 feet, with different upper and lower tolerances if required.
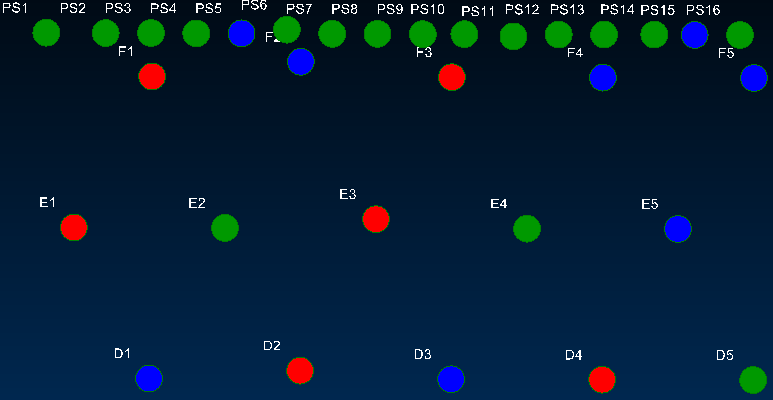
Each hole displays in the Viewport in one of the following colours:
- Red—The hole is short; that is, the hole has been drilled shorter than the hole design minus the specified lower tolerance.
- Green—The hole is within the specified tolerance.
- Blue—The hole is long; that is, the hole has been drilled longer than the hole design plus the specified upper tolerance.
You can run the drilled depth accuracy report in either a 2D or 3D mode. The 3D mode is more effective if you want to rotate the view in the Viewport. The report cannot be exported, but can be printed. See Print Viewport Objects.
The following 2D example shows a selection of holes in a drill pattern. The pre-split holes (prefixed with 'PS') are almost all within the tolerance; however, many of the production holes are either short or long.

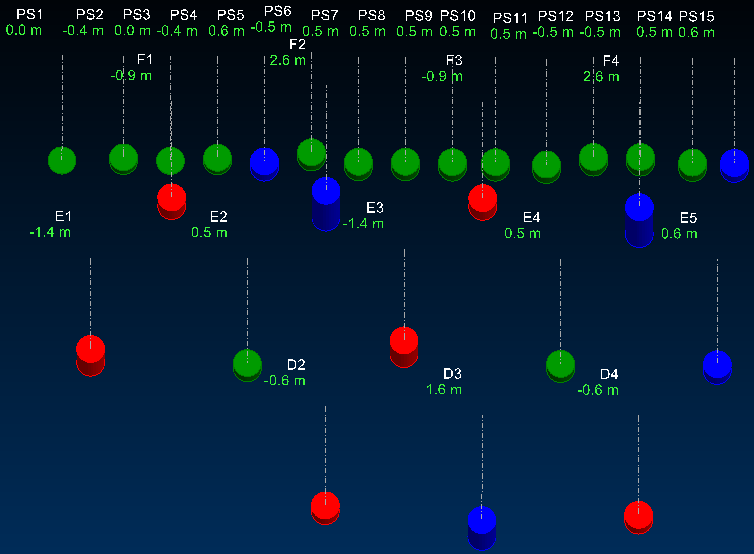
The following 3D example shows the same holes as above with the hole ID and drilled to setout depth difference options selected on the Layers Toolbar (Drill Module).

Drill Accuracy Reports
Use a drill accuracy report to display a representation of which holes have been drilled in a different position than designed.
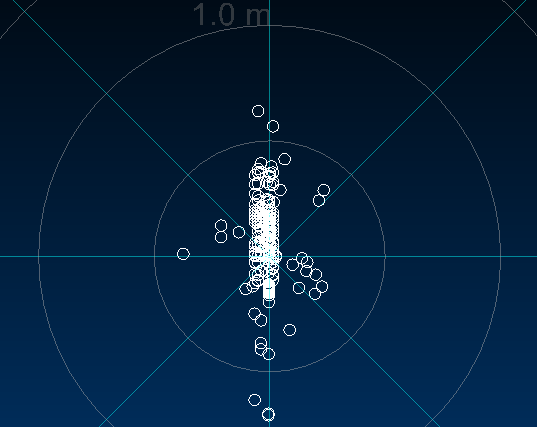
The report displays as a target plot in the Viewport for either the collar positions or the toe positions. For the collar report, the setout collar is used if available, otherwise the design collar is compared with the as-built (drilled) collar. For the toe report, the design toe is compared with the as-built toe.
The compass plot is a way of representing both direction and distance. The further out from the centre, the less accurate the drilling position of the hole.
These compass plots can be printed from the Viewport, or combined as a printed report.
The following example shows a drill pattern where most holes were drilled within 0.5 m of the designed position and that the accuracy was higher along the E–W axis than along the N–S axis.

Drill Accuracy Report (for Printing)
A drill accuracy report is a summary of the depth and drill accuracy of selected holes. The report is designed to be printed.
The design and content of the report is fully customisable. A typical drill accuracy text report may have a summary of how many holes are in specification, short and long. This information may be presented as a table and as a histogram. The report may also include a graph of the collar and toe drill accuracy.


