
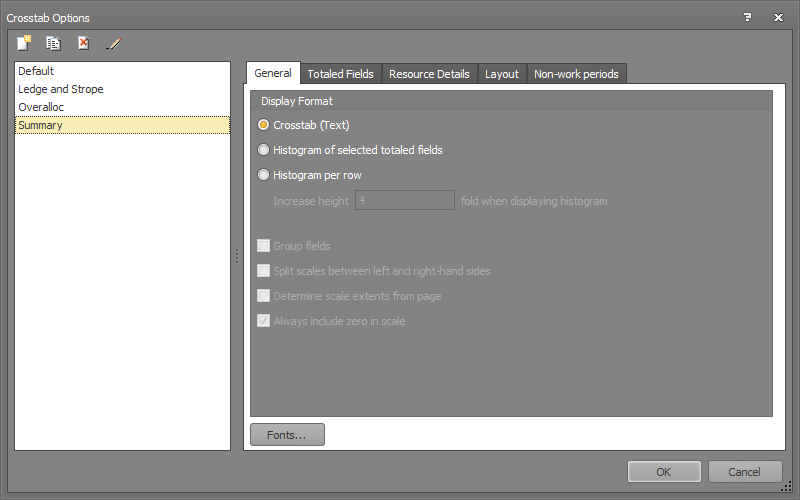
Crosstab Options: General
This tab allows you to select the appearance of the reported totaled fields in the Crosstab reports.
The following table describes the fields on this tab shown below:
|
Field |
Description |
|
Crosstab (text) |
Select this option to display the reported totaled fields as numeric values in a table format. By default, this field is selected. Note: You can also click
|
|
Histogram of selected totaled fields |
Select this option to display the fields that you selected in the On histogram column of the Totaled Fields tab, on a single histogram chart. If you select this field, the Display S-curve field activates. Note: After you set your options, to activate this display click in the Crosstab Format toolbar. |
|
Display S-curve |
Select this field if you want to display an S-curve as well as a histogram of the selected fields. |
|
S-curve format |
Click to display the screen that allows you to change the format of the S-curve. |
| Scale on right-hand side | Select this field to display the scale for the S-curve on the right-hand side of the Crosstab area of the DTS screen. |
|
Histogram per row |
Select this option to display the fields that you selected in the Totaled Fields tab and Resource Details tab, as individual histogram charts. If you select this field, the Increase height field activates. Note: after you set your options, to activate this display click |
|
Fonts |
Click to display the Text Styles screen, which allows you to format the text displayed in the Crosstab report. |
|
OK |
Click to save your changes and close the screen. |
|
Cancel |
Click to lose the changes you made and close the screen. |
|
Help |
Click to display the help for this screen. |
Related topics and activities