
The Crosstab
The Crosstab is a key part of the DTS system, used to display fields (mainly production and summary) and their respective values over time.
The view uses colour coding to highlight where production values fall outside of the targets, or resources are overloaded. In the following example green italic text shows production below target, and bold red text shows production above target. Resource scheduled over capacity is also shown in bold red.
The Crosstab area is divided in two areas: the Crosstab header on the left and the Crosstab report on the right:
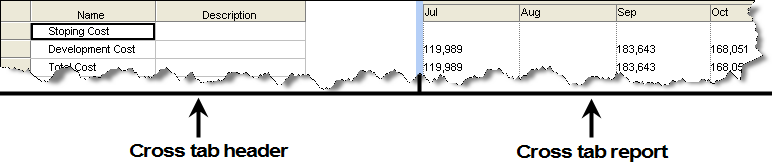
The timeline of the report section shows the same magnification as the Gantt chart area so you can easily associate task bars with a time and value context.
Note: You can apply filters to this information for more advanced reporting.
The Crosstab area lets you display different data depending on right-click menu selections, for example:
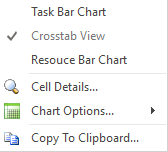
The following options are available:
-
Task Bar / Crosstab – Swap between area types.
By default, Crosstab is selected, which displays the summed or weighted information from the Task Table (both custom and fixed fields) totalled for each Date column in a tabulated or graphical format.
-
When the Crosstab is displayed, right-clicking a cell in the Report area displays the following options:
-
Cell Details – Display the Crosstab Cell Details screen to see more information about the cell, including the activity data contributing to the result and the associated date range.
-
Chart Options – Configure the current Crosstab view using the Crosstab Options screen.
Note: You can also swap between Default and Flowchart type Crosstab presentations by expanding the Chart Options menu item.
-
-
-
Resource Bar Chart - displays the resource information. If you do not have resources defined, this information is blank. If you have resources defined but not assigned, the Crosstab header displays the resources. If you have resources assigned, for each resource that is assigned the Crosstab header displays the tasks that have that resource assigned to them.
Note: If the Resource Bar Chart is already displayerd, the menu includes an Options entry. This displays the Resource Bar Chart Options screen.
- Copy to Clipboard - this option is available only when you have selected Cross Tab View. This options allows you to copy the contents of the Crosstab area to the Clipboard and paste it to, for example Microsoft� Excel.
Related topics and activities