
Create a Pivot Table
A pivot table lets you summarize task data and group it in various ways on the horizontal and vertical axes.
Create a New Pivot Table View
To create a new, empty pivot table:
-
Load the schedule containing data to pivot.
Note: Each schedule will create its own new window to display a pivot table related to that schedule.
-
View ribbon >> Create New View >> Pivot Table.
A new pivot table view with default settings displays. The tab at the top of the screen shows the name of the active project.
At the bottom of the window, two further tabs display:
-
Pivot Table – Display and configure pivot table data.
-
Chart — Show summary chart output for your data.
-
To configure an existing pivot table using the pivot table view:
-
Display a pivot table view.
-
Using the Field List on the right, expand the fields folders (Baseline Fields, Code Fields and so on) to locate the attribute containing values to be pivoted using other attributes.
-
Decide which field(s) you want to report and add this field to the Data Area, for example, to report monthly Total Cost values by the default timeline (Column Area):
-
Expand the Standard Fields folder.
-
Locate Total Cost.
-
Drag Total Cost to the Data Area panel below.
The pivot table updates to show total cost by month, for each column of the timeline.
Note: You can also drag your field to the empty row of the actual pivot table ("Drop Data Items Here") to achieve the same result.
Note: The task filter selected on the Data Area tab of the Pivot Options screen limits which records are included before the pivot table is calculated.
-
-
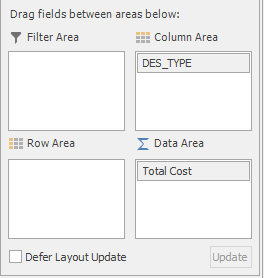
Decide how you want to report your data (that is, the columns across the top of the table) by dragging a field into the Column Area.
Note: Fields selected on the Column Area tab of the Pivot Options screen populate the Column Area on the main Pivot Table screen. These fields control the column grouping in the pivot table.
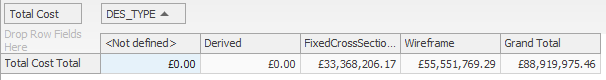
By default, this is the timeline, but you can report against any other field, say to show the Total revenue (Data Area) by Code Fields >> Design Type (Column Area) with no time context (that is, considering the entire project schedule), for example:
Note: You can also drag fields to the top row of the pivot table to add one or more column fields.
-
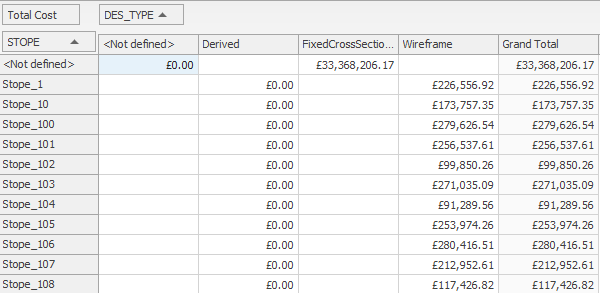
By default (without any additional fields in the Row Area), the total (SUM) of values displays for each table cell. To further categorize your results (say, to show the same total cost information above, by design area, but for each individual stope), add fields to the Row Area, for example:
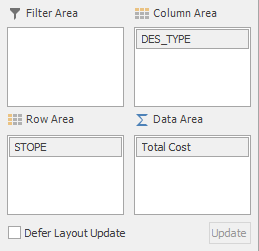
Note: Fields selected on the Row Area tab populate the Row Area on the main Pivot Table screen. These fields control the row grouping in the pivot table.
-
To get another view of your data, consider creating a pivot table chart.
-
Save your project.
Edit a Pivot Table (Pivot Options)
To edit an existing pivot table using the Pivot Options screen:
-
Display a pivot table view. It can contain data or be empty.
-
Home ribbon >> Pivot Table >> Options.
The Pivot Options screen displays.
-
Configure General pivot table options. See Pivot Options: General.
-
Select the Row Area tab and configure how rows appear in the table. See Pivot Options: Row Area.
-
Select the Column Area tab and choose which column(s) appear on the table. See Pivot Options: Column Area.
-
To apply a Task Filter to the view, select the Data Area tab. See Pivot Options: Data Area.
-
Click OK.
The pivot table updates to show the latest values.
-
Save your project.
Related topics and activities