
Pivot Tables
A pivot table lets you summarize and group task data in a variety of ways (both on the horizontal and vertical axes). Unlike other pivot table tools (including Excel), DTS is able to create weighted cross tabulations.
A pivot table has the following primary elements, with each pivot table view representing a particular project schedule.
-
Rows – The structure of the pivot table rows is effectively the same as a grouping in EPS. Row fields are shown in the Row Area of the main screen configuration area.
-
Columns – This can either be based on a date scale (the default), or it can be based on any other task field in DTS. Row fields are shown in the Column Area of the main screen configuration area.
-
Values – Pivoted values (such as revenue per level per time period) appear in the main pivot table, and can also be displayed as a chart. See Create a Pivot Chart
Pivot tables can be configured using the controls on the right side of the pivot table screen (Field List, Filter Area, Column Area, Row Area and Data Area) or the Pivot Options screen (or a combination of both).
See Pivot Options.
A pivot table view also has a Chart tab, so you can present your pivoted data using a wide range of charting tools.

An example of a DTS pivot table showing remaining development cost over time
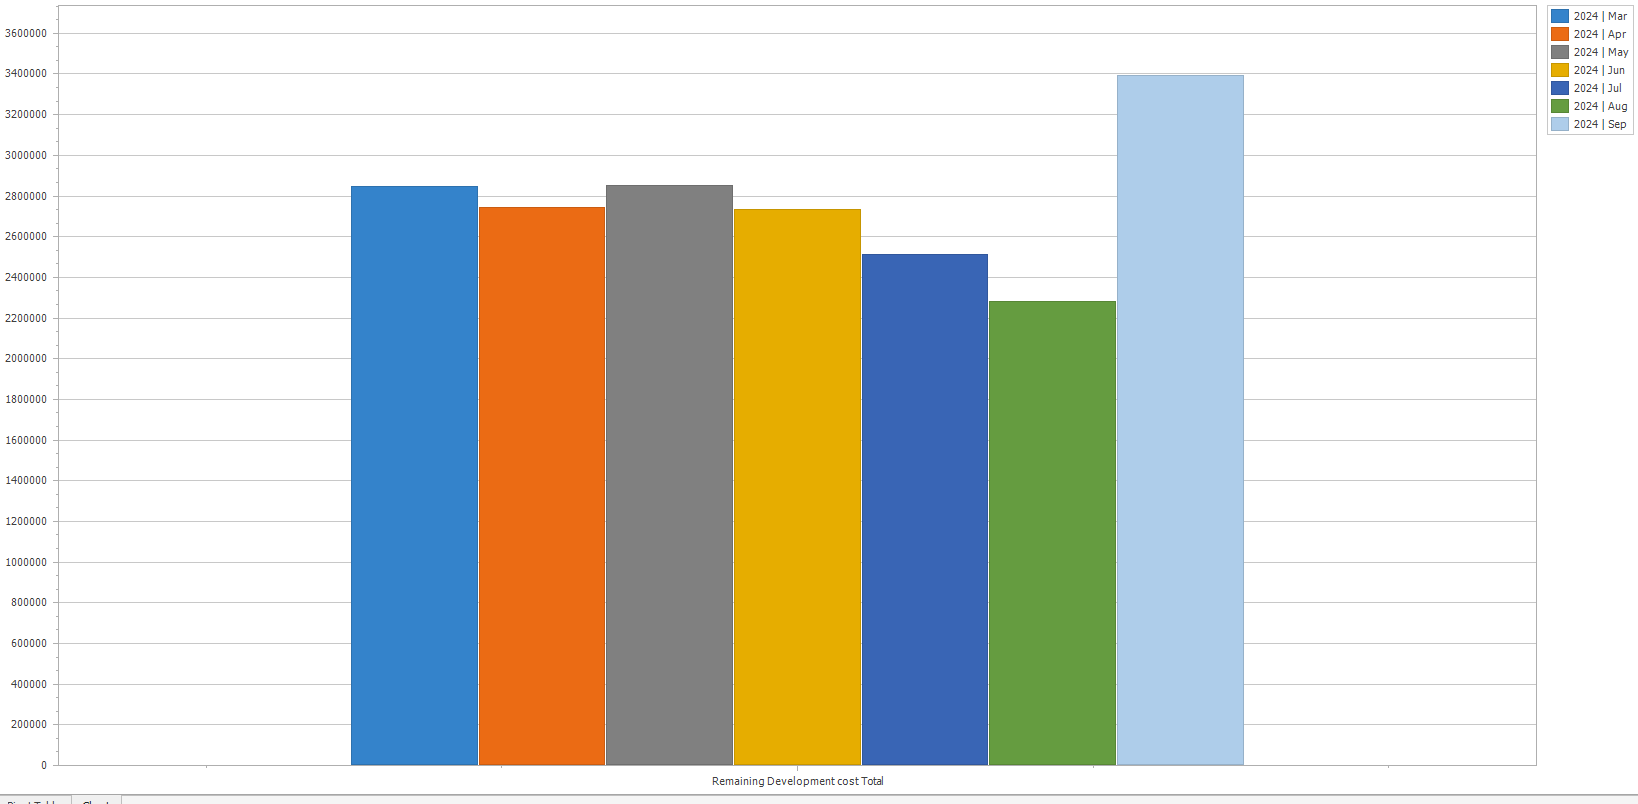
An example of a DTS Chart (based on the pivot table above)
Each schedule can be supported by one or more pivot tables, accessible via the Current Pivot Table list on the Pivot Table Home ribbon.