
Combine Points
-
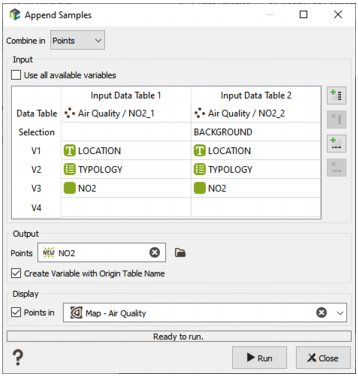
Input:
-
You can click
 to open a Data Selector to select the data tables you want to combine. The data tables can also be dragged and dropped directly from the Data tab. The input data tables can be of any type: Grid, Borehole Assays or Points, 2D or 3D, but they will be considered and merged as points data tables in output. There is no restriction of the number of data tables to combine. Use the
  and
and  buttons to add or remove data tables. You can define an optional Selection variable to merge only a subset of the data table. By default all the variables contained in the input data tables are combined. In this case, the variable name will be used to associate the variables together. If a variable is present in a table and not in another one, the corresponding samples will be set to undefined.
-
Untick the Use all available variables option to choose the variable(s) which will be combined. There is no restriction on the number of variables as the program may merge as many variables as you wish. Use the
 and
and  icons to add or remove variables.Variables can be of any type: numerical, categorical, alphanumerical or selection variables. In this case, the variables association will not be based on the variable name but on the order you defined. It enables the combination of variables associated to different names. If any variable is defined for one of the input table, corresponding output samples will be set to undefined. The output variable name will be the name defined by the first data table (or the second one if any variable is not defined).
In batch, a parameter referencing the number of input variables is informed but not present in the interface. Be careful if you manually modify the input variables in the batch to also change the number of variables if different from the registered one.
-
You can click
-
Output:
- Define the new output Points data table where the variables will be combined. The names of the input variables will be kept as the names of the corresponding output variables in the output file. A new points file will be created with as many samples as there are selected samples in the input data table. It will be 2D or 3D according to the dimensions of the input data table. The coordinates of the samples are those of the selected samples.
- Tick the Create Variable with Origin Table Name option to create a categorical variable corresponding to the name of the input data table as an ID of the original data table.
- Click Run to create the new output points data table. If the data table already exists, a warning message is issued to ask you for confirmation. After confirmation, the previous data table will be deleted and rebuilt.
- The output points can be displayed in a 2D/3D view in the standard way (Drag & Drop from the Data Explorer to the Map/3D view) at the end of the run. However it is possible to automatically display the result of the run by ticking the Display toggle and selecting a scene. A layer will be created in the corresponding 2D/3D scene.