
Grade Capping
If the option Grade Capping has been selected this window should pop up. The aim of Grade Capping is to cap data that are above or below a given threshold.
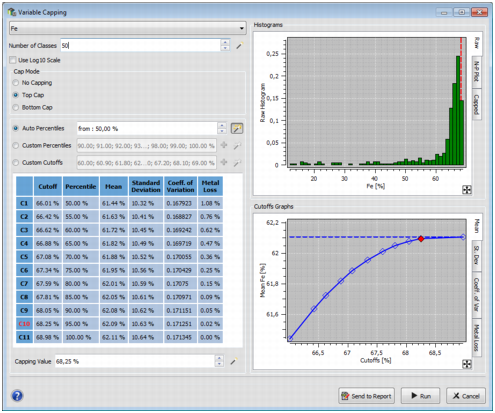
On the top side of the pop-up window, select the Variable on which the capping is performed.
- Number of Classes: Select the number of classes represented in the top right side histograms.
- Log10 Scale: Log10 Scale option is available for the X-axis of the different graphs and histograms.
By default, the No Capping option is selected. Two Cap Modes are available:
- A Top Cap Mode: An upper limit is set. Values that are above the threshold are set equal to it.
- A Bottom Cap Mode: A lower limit is set. Values that are below the threshold are set equal to it.
To help defining the Capping Value (or Threshold), it is possible to create a range of test values based on different processes: Auto Percentiles, Custom Percentiles, and Custom Cutoffs.
For each test value, data that are above the Cutoff/Capping Value or the corresponding Percentile, are capped. The Mean, the Standard Deviation, the Coefficient of Variation and the Metal Loss/Metal Gain (Metal Loss in the Top Cap Mode and Metal Gain in Bottom Cap Mode) are recalculated following the capping operation. All these tests are gathered in a table.
- The Auto Percentiles process defines automatically a range of test values between the 50-percentile (respectively 0) and the 100-percentile (respectively the 50) in the Top Cap Mode (respectively Bottom Cap Mode) with an increment of 5%. If the default value is modified, a range of test values will be created from the defined percentile value to the 100-percentile in the Top Cap Mode or from the 0-percentile to the defined percentile value in the Bottom Cap Mode with a constant increment.
- The Custom Percentiles process defines automatically a range of test values from the 90-percentile to the 100-percentile in the Top Cap Mode and from the 0-percentile to the 10-percentile in the Bottom Cap Mode.
- The Custom Cutoffs process defines automatically a range of test values from the minimum value of the selected variable to the mean in the Bottom Cap Mode and from the mean to the maximum value of the selected variables in the Top Cap Mode.
Note: Percentiles are values that divide a set of data, rank ordered from the smallest to the largest, into 100 equal parts.
Click on ![]() to set default values or lists.
to set default values or lists.
Click on ![]() to modify the Percentile or the Cutoff List.
to modify the Percentile or the Cutoff List.
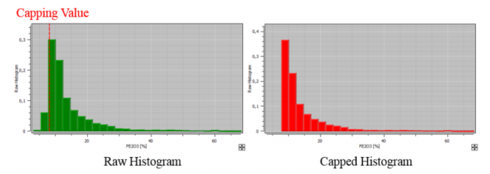
The Capping Value can be selected on the different Cutoffs Graphs (Mean, Standard Deviation, Coefficient of Variation and Metal Loss/Gain) by clicking on a diamond. The user can also enter a Capping Value in the bottom side field or click on a class of the Raw Histogram. The capped value is indicated on the Raw Histogram by a red vertical line. If the Capping Value does not already exist in the table, a new line corresponding to this test value will be created.
The impact of the Grade Capping operation can be visualized on the Capped Histogram.
Normal-Probability Plot is available as a decision-making tool.
Press Run to validate the capping and to return to the Grade to be Estimated step.