
Charts
All the views of all the graphic pages will be displayed in this section, organized in several tabs corresponding to a subset of all the views.
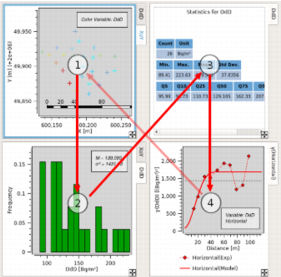
All the views are dynamically linked together, that is, when performing any action in a view (highlight, mask samples), all the other views are automatically updated.
-
Exploratory tab:
By default, a new view is added in the Exploratory tab, except for the items which generate several views as the swath plots, the anamorphosis and the variograms. In this particular case, some dedicated tabs will be added. Corresponding options will also be available to select a subset of the views related to one or several variables (as the selection of the displayed direction of the variogram for example).
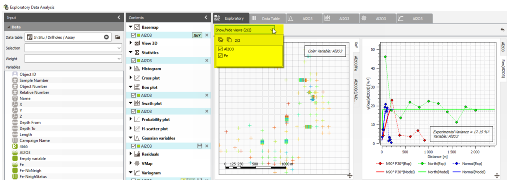
In each tab, the views are organized following lines and columns. By default in the Exploratory tab, views are displayed following a 2x2 schema (from top to bottom and left to right). If more than four views are displayed, tabs are added above the previous views keeping the same order.
Views can be moved to arrange them by using the icon
 in the right bottom corner of the view. In this way, it is possible to add new columns or lines. By a double-click on this same icon, the view will appear in a bigger flying window (click on
  to close it). Views can also be stacked, each one of them being reachable by a tab. Click on
  to get the default organization back.
-
Data Table tab: a unique tab containing the data table is always here. It displays:
- the current mask,
- the sample number,
- the object name (lines, polygons...),
- the coordinates,
- all the variables referred to an item,
- the transformed variables (gaussian and residuals).
Values contained in the data table are not editable, they cannot be sorted or filtered.
The sample highlight is synchronized with the other views.
-
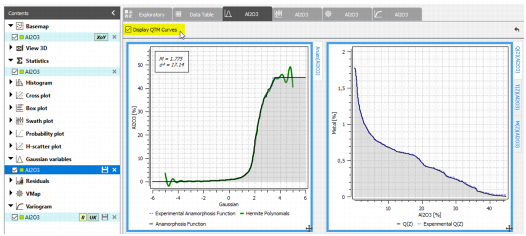
Anamorphosis tab: this tab gathers the views associated to a gaussian variable. It is named by the raw variable name. It contains:
- a view with the anamorphosis model,
- a view mixing experimental and theoretical histograms,
- views with QTM curves: Q(Z), T(Z), M(Z) and Q(T). These views can be displayed or not by ticking or not the corresponding toggle.
-
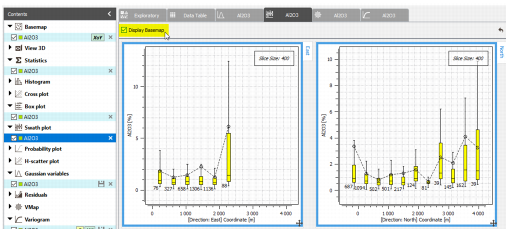
Swath-Plot tab: this tab gathers the calculation result of the swat-plot for each axis, corresponding to 2 or 3 views depending on the data dimension (2D/3D). The Display Basemap option is only available if a basemap or 3D view with the same variable has been created. It adds the basemap / 3D view to the current perspective.
-
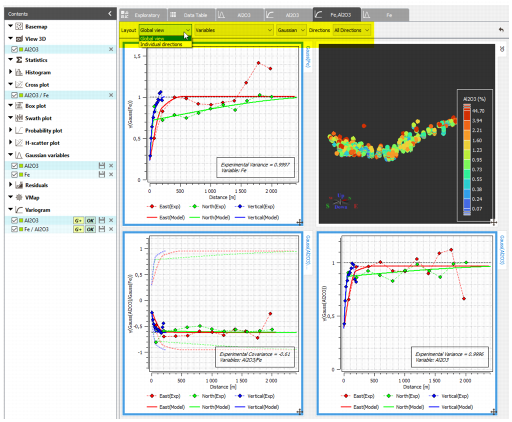
Variogram tab: this tab gathers views displaying the experimental variogram, the variogram cloud, as well as the variogram model.
As the views may be numerous, several filters located on the top bar will display only the corresponding views:
-
Layout
- Global view: all the computed directions are displayed on one graphic. This is an overview. One particular direction can be displayed via the Direction selector.
- Individual directions: each direction is displayed individually on one graphic. There are as many graphics as directions, plus graphics displaying some groups of directions (all, horizontal, special and free directions). In a multivariate case, variable selectors allows to select two variables V1 and V2, at maximum. When selecting twice the same variable, only the simple variograms are computed. This layout is only available for multidirectional variograms. The Direction selector is not available in this layout.
-
Variables
- Choose for which variable(s) the variograms are displayed. It will result in computing simple and cross variograms. This selector only appears in a multivariate case.
-
Transformation
- Choose to display the Raw or the Gaussian representations. This selector only appears when the Model option "Compute raw and gaussian models" is chosen in the Parameters panel.
-
Directions
- Choose which direction(s) are displayed. This selector only appears with the Global view layout.
-
Note: In the particular case of a mono-variable variogram, the associated views will be also displayed in the Exploratory tab.
If you have also asked the calculation of the corresponding cross-plots, basemaps and 3D views, these ones are added in the Variogram tab, symmetrically to the variograms in multivariate case.