
Grid Filling
Objectives
The Grid Filling functionality is designed to fill grid nodes with data should the variable information be missing at these nodes. It only works for a variable defined on a regular grid. The procedure offers two methodologies:
- the Kriging interpolation;
- the Simulation algorithm.
Interface
-
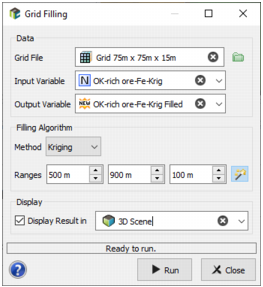
Data:
- Grid File: Click the directory icon next to Grid File to open a Data Selector and select the grid where the input data are stored and on which the Grid Filling task will be applied. The Grid File can also be dragged and dropped directly from the Data tab.
- Input Variable: Choice of the variable to be read. Obviously the input variable must already exist.
- Output Variable: That is the variable where the results of the calculations will be stored. The Output variable may be a new one or an already existing one.
-
Filling Algorithm:
-
Method: Two methods are offered: Kriging and Simulation (conditional) using the SPDE methodology. Both methods use an exponential model of variogram and a unique neighborhood. Using morphological tools, we select the cells located in the edge of the area to fill in.
The neighborhood area is defined to take 10 cells in 2D and 5 cells in 3D along each direction. Data are centred and normalized (with a mean of 0 and a variance of 1) before the filling, then back-transformed after the kriging/simulation. In this way, the variogram model always has a sill of 1 in the normalized space.
The kriging will give the most probable value, with a smoothing effect inherent to the method, while the simulation will explore all the variability of the phenomenon. But both methods respect the data distribution (i.e. the histogram), the data variability (i.e. the variogram) as well as the data values.
- Ranges: Enter here the distances along U/V(/W) to consider for the range of the exponential variogram model. The default value is defined to be approximately equal to the quarter of the field size (i.e. the grid size) along each direction.
-
- The output variable can be displayed in a 2D/3D view using the standard way (Drag & Drop from the Data Explorer to the Map/3D view) at the end of the run. However it is possible to automatically display the result of the run by ticking the Display toggle and selecting a scene. A layer will be created in the corresponding 2D/3D scene.