
Results
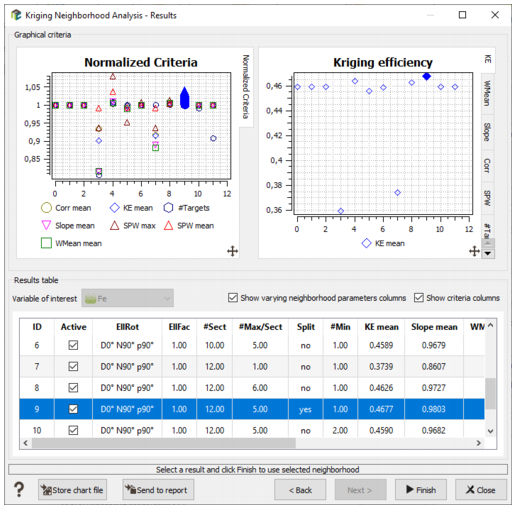
This window shows the Overall Graphical Criteria (left hand side graph) and each criterion one by one (right hand side graph).
The Overall KNA Statistics is a normalized diagram on which all the criteria are overlaid. The normalization of each criterion is performed against the reference neighborhood test which is given the value 1. The vertical scale can be interpreted as a gain factor: if a criterion gives a better result than the reference neighborhood for a given test, the symbol will appear above the horizontal line 1. Conversely if a test shows a poor criterion value when compared to the reference neighborhood the symbol will show below.
The horizontal axis of the different graphs corresponds to the rank (ID) of the tests.
In case of multivariate kriging, select the Variable of interest to see the corresponding graphics and statistical results.
The table gives access to all the results of the various tests. Each line corresponds to one kriging run/test and the flag Show varying parameters columns and Show criteria columns allow tuning the layout of the table.
Note: Only the cells estimated on all the kriging runs are used to compute the geostatistical criteria. The Active column enables one to deactivate a kriging run with too few estimated cells that might bias the analysis. If a kriging run is deactivated, the geostatistical criteria are recomputed on the shared estimated cells of the remaining kriging runs.
By default, a kriging run is deactivated if it has less than 50% of estimated cells than the reference test.
All graphs and the table are linked together and one may click on any symbol of any graph in order to select a specific test which will be highlighted on all graphs, using solid blue symbols.
Click ![]() Store Chart File to save the generated graphics and tables in a Chart File.
Store Chart File to save the generated graphics and tables in a Chart File.
Click ![]() Send to report to send the content of all the visible views (depending on the current tab and if a filter has been activated) in the Reporting Window.
Send to report to send the content of all the visible views (depending on the current tab and if a filter has been activated) in the Reporting Window.
Press Finish, once the adequate test ID has been selected. The corresponding parameters will be automatically copied into the current neighborhood of Isatis.neo.