
Use the Dashboard
The MSO dashboard provides summary information about the results of your MSO run.
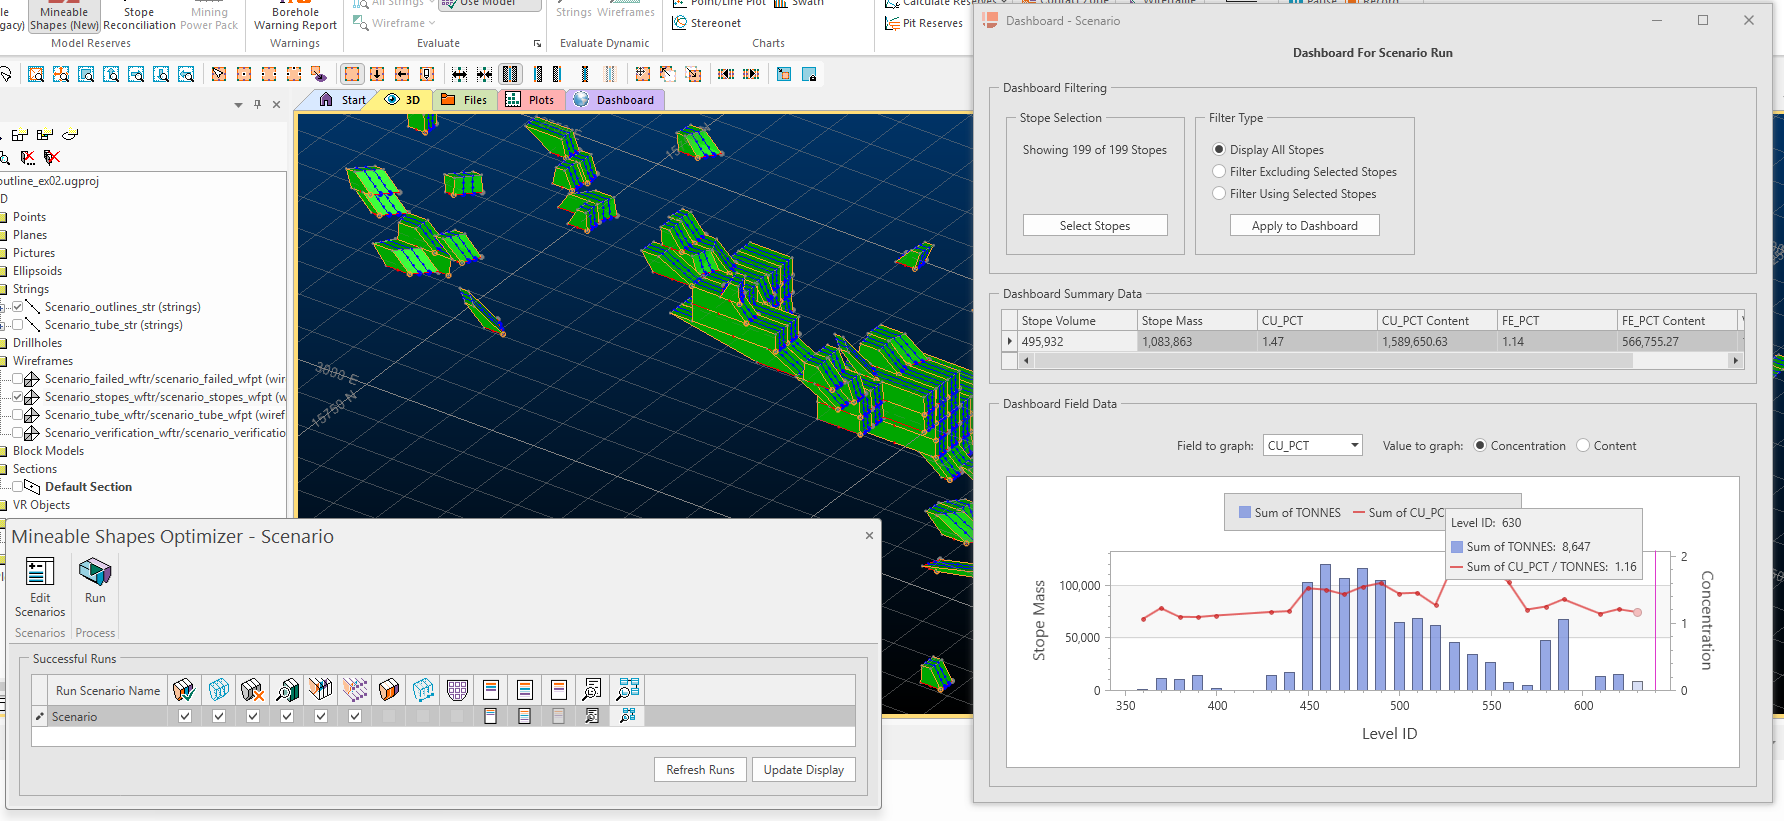
The MSO dashboard and associated stope data
By default, the dashboard reports data against the nominated optimization field, but you can also show results for any reporting field and constrain results to reflect a subset of stopes
Reporting Fields
Regarding additional reporting field it is important to note that not all field types are displayed on the Dashboard, only numeric fields with the accumulation methods depicted below. The other field types can be visualized on the Detailed Report file as usual.
For weighted fields the summary table displays the concentration and the content. The concentration is displayed as defined on the Scenarios panel | Data Fields table and it can be by mass or volume.
The content is the concentration multiplied by either mass or volume. This being said, for percentage fields it is important to make sure the number is represented as a fraction in order to have the Dashboard displaying the correct content value.
Note: Add reporting fields either using the Block Model or Report screens.
Viewing Dashboard Charts
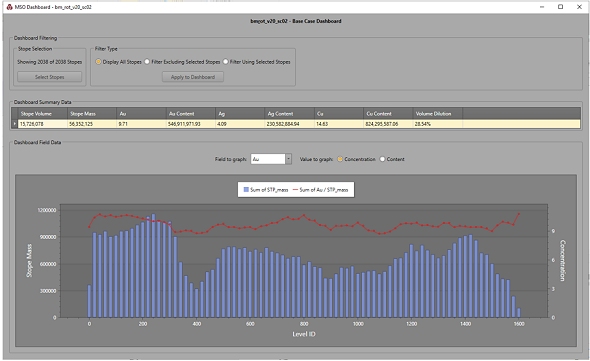
The summary chart is displayed by LEVELID, grouping stopes that belong to the same level.
The left axis is for the stope mass, represented by the blue bars. The right axis is related to the selected field element, represented by the red line, for example:
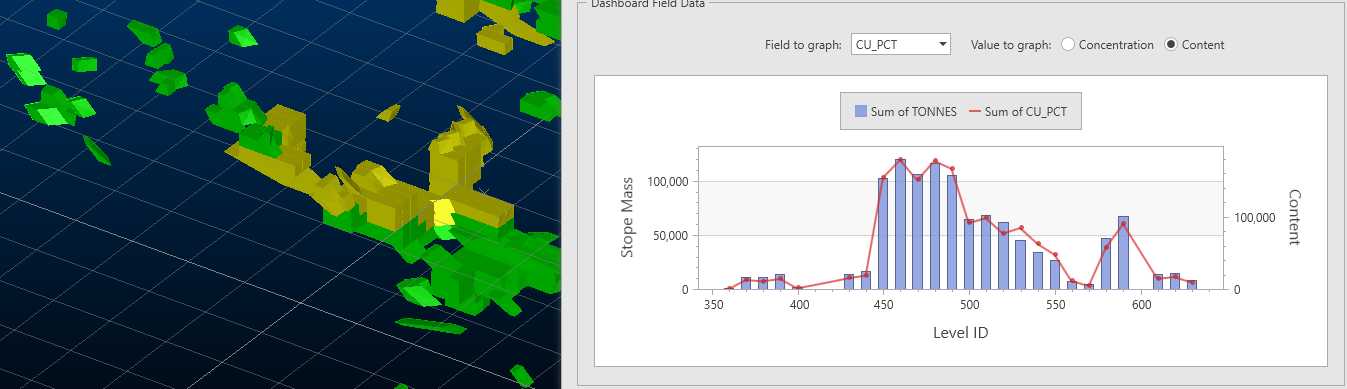
The field element can be changed using the Field to Graph which lists the same fields displayed on the summary table. In case a field is weighted by volume, when selected, it will change the left axis to Stope Volume instead of Stope Mass.
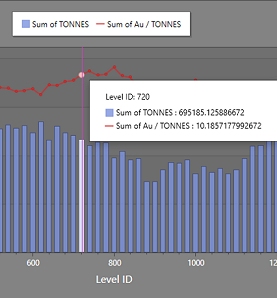
Moving the mouse arrow over the summary chart will display window with detailed values for stope mass (or volume) and the selected field element for each level, for example:
Activity steps
-
Complete at least one MSO run.
-
Display the Review screen.
-
For the target scenario, click Show Dashboard:

-
To show results for a subset of stope data:
-
Ensure stope wireframes are displayed. Use the Review screen to do this.
-
On the Dashboard, click Select Stopes.
-
In the Filter Type group, pick a filter option:
-
Display All Stopes – Ignore data selection and show results for all stope wireframe data.
-
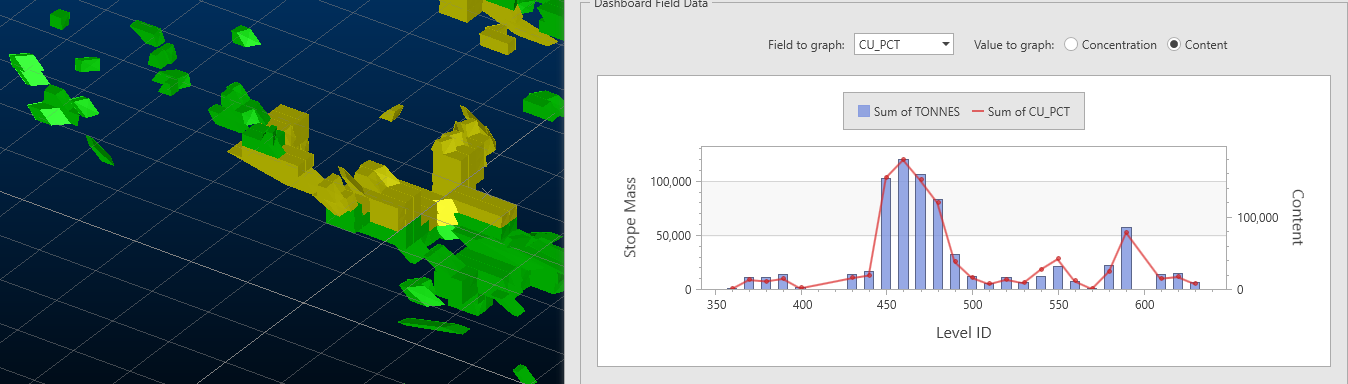
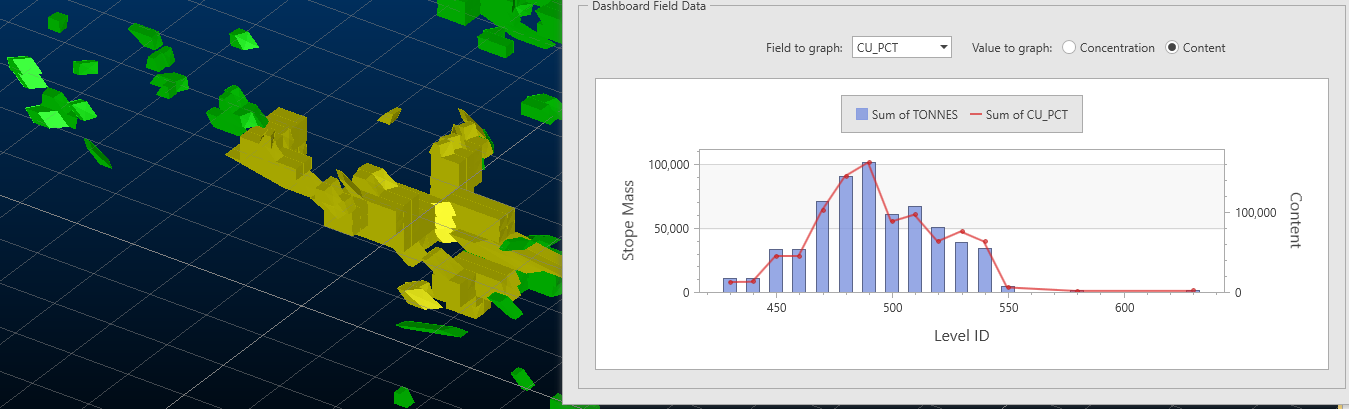
Filter Excluding Selected Stopes – Remove the selected stope data from the evaluation results. For example, the image above shows all stope data, and the lower image shows the results where selected data are excluded (click to expand):
-
Filter Using Selected Stopes – Show results that relate only to selected stope data, for example:
-
-
Click Apply to Dashboard to update the current results.
-
-
Review Dashboard Summary Data. This table shows evaluation results for all reporting fields:
-
Stope Volume – The overall volume that correspond to the BINDESC field DILUTED_TOTAL (total rock inside the diluted shape).
-
Stope Mass – The tonnage that corresponds to the associated Stope Volume.
-
Product Grade – For each reporting field.
-
Product Content – For each reporting field.
-
-
Review the Dashboard Field Data:
-
Choose Field to Graph.
-
Display field data as a Concentration or Content format.
-
Interrogate specific data points by moving the cursor over the graph.
-
Related topics and activities