
Review Processed Results
Manage and display results from completed MSO runs. It functions as a visualization control centre, where you can selectively enable or disable the display of output files associated with any processed scenario.
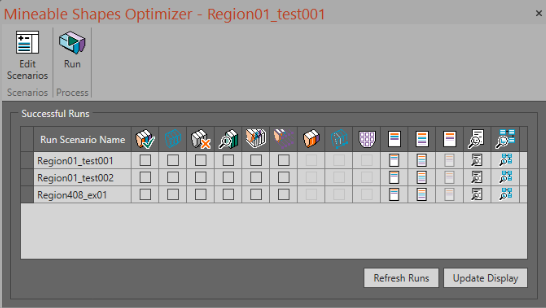
The Review screen showing completed runs
This screen features a grid of check boxes (on the left) and command buttons. (on the right).
Displaying 3D data associated with a scenario is a case of selecting the data type for a given scenario, then clicking Update Display to show that data in the Studio 3D window.
Reports are displayed using the right most buttons. Various reports (and a dashboard) are available to help you better understand what MSO has generated and why.
Note: Access the Review screen from either the standard MSO workflow ribbon or the Run screen.
Activity steps
-
Create an MSO scenario and define a block model.
-
Configure other settings as required.
-
Display the Review screen.
-
For each scenario, to display 3D data, check one of the following table columns:
Note: Items are only selectable if they have been generated.

Optimization wireframes The final 3D shapes of the stopes generated by the optimization. 
Outline strings Boundary outlines of stopes, useful for section views. 
Failed wireframes Stopes that were rejected due to economic or geometric constraints. 
Verification wireframes Diagnostics for each stope, like seed, hanging wall, footwall. 
Tube wireframes Wireframe representations of the haulage access tubes. 
Tube strings String representations of tubes, useful for reference and design handover. 
Merged wireframes Stopes merged after post-processing (e.g. split/merge rules). 
Merged strings Outlines of merged stopes in string format. 
Mined out block model Block model marked as mined where stope solids intersected. -
Click Update Display to load all checked items in the Studio 3D window.
-
View one of the following results resources:

Summary report High-level output summary including tonnes, grades, and value. 
Detailed report Full listing of stopes with their economic, design, and rule data. 
Merged report Outputs for stopes after post-processing adjustments. 
Log file Backend log of the optimization run (can be useful for diagnostics). 
Dashboard Interactive chart-based dashboard summarizing run KPIs.
See Use the Dashboard.
-
Run data will appear on the Review screen for selection as each run completes. You can update the display of the table at any time by selecting Refresh Runs.
Related topics and activities