Explore Invoice Details
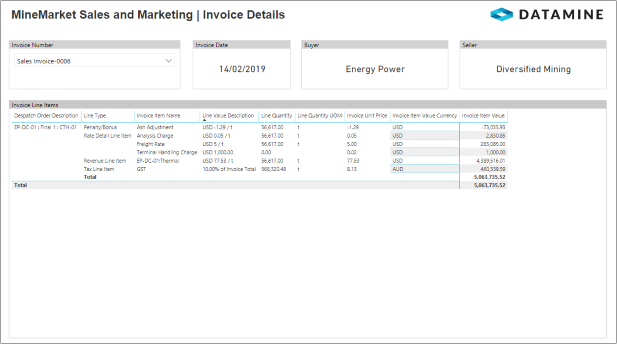
This example builds on the Invoice Explorer report in Power BI to display details of line items for a sales and purchase invoice.
The data comes from the Invoice endpoint in the Marketing OData feed.
Note: This report depends on data filtering applied in the Invoice Explorer report in Power BI. Therefore, Datamine does not provide a separate PBIT file for this report.

Query Editing
Create a query for the invoice line items
- On the Home ribbon of the Query Editor, select Get Data or Recent Sources and load an instance of the Invoice endpoint's data.
- Rename the query "Invoice_Line_Items".
- Remove the extra columns:
- Press and hold Ctrl while clicking the InvoiceNumber, Id and InvoiceLineItems columns.
- Right-click and select Remove Other Columns from the menu.
- Drag the Id column so that it is next to the InvoiceNumber column.
- Rename the columns "Invoice Number" and "Invoice ID".
- Expand the linked InvoiceLineItems table, with all columns selected, but with the Use original column name as prefix checkbox cleared.
- Rename the columns to add spaces; for example, "Invoice Line Item ID", "Despatch Order Description", "Line Type".
Create a query for the buyer and seller
- On the Home ribbon of the Query Editor, select Get Data or Recent Sources and load an instance of the Invoice endpoint's data.
- Rename the query "Invoice_Buyer_Seller".
- Remove the extra columns:
- Press and hold Ctrl while clicking the InvoiceNumber, Id and Contracts columns.
- Right-click and select Remove Other Columns from the menu.
- Expand the linked Contracts table, with only the Buyer and Seller columns selected, and with the Use original column name as prefix checkbox cleared.
- Expand the Buyer and Seller columns, with only the OrganisationName column selected.
- Rename the "Invoice Number" column to add a space, and simplify the names of the Buyer and Seller columns.
- Right-click the query and select Remove duplicates from the menu.
- On the Home ribbon, click Close & Apply.
Check table relationships
- On the Home ribbon (of Power BI's main interface, not the Query Editor), select Manage Relationships.
- Check that the following relationships are active:
- From Invoice_Line_Items (Invoice ID) to Invoice_Main (Id)
- From Invoice_Line_Items (Invoice ID) to Invoice_Buyer_Seller (Id)
- Check that the Cardinality is Many to one (*:1) and the Cross filter direction is Both for both relationships.
- Click OK.
Invoice Number Filter
|
|
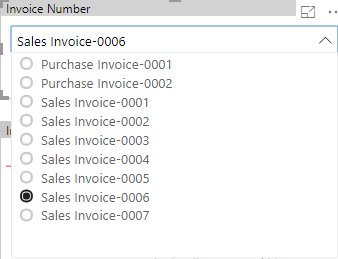
This slicer visual displays the Invoice Number field from the Invoice_Line_Items query. The visual is set to the Dropdown slicer type, and single-select is enabled. Because the filters on the Invoice Explorer page have been synchronised, only the invoices displayed on the Invoice Explorer page display in the list. Note: The radio button form of single-select filters was introduced in the March 2019 release of Power BI. |
Cards
Three card visuals display information about the selected invoice:
- Invoice Date from the Invoice_Main query
- Buyer from the Invoice_Buyer_Seller query
- Seller from the Invoice_Buyer_Seller query
Invoice Line Items
|
|
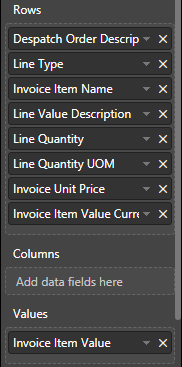
The invoice line items display in a matrix visual, with the data coming from the Invoice_Line_Items query. The rows are Despatch Order Description, Line Type, Invoice Item Name, Line Value Description, Line Quantity, Line Quantity UOM, Invoice Unit Price, Invoice Unit Price Currency, Invoice Unit Price UOM, Invoice Item Value Currency. The values are Invoice Item Value. In a matrix visual, values are aggregated in the totals. Note: Additional rows and values can be selected if required, but if too many rows and values are selected, not all data can be viewed. Matrix visuals cannot be scrolled horizontally. In the formatting settings under Row headers, Stepped layout is disabled in order to display the rows as columns. If not all rows (columns) are visible, click the Expand all down one level in the hierarchy icon in the top of the matrix visual as often as required. In the formatting settings under Subtotals, Row subtotals and Per row level are enabled, but then only the subtotal for the Despatch Order Description and Line Type rows are enabled. Important: No currency conversions are handled in Power BI. Therefore, the Total rows only display meaningful data if all displayed invoice instalments are in the same currency. |


